Hospital-Record-Analysis-Dashboard
تفاصيل العمل
ملخص المشروع
المشروع عبارة عن تحليل دقيق لسجلات زيارات المستشفى، والهدف منه كان استخلاص نتائج واضحة عن معدلات نجاة المرضى والعوامل اللي بتشكل خطر على حياتهم. اشتغلت فيه على تحويل بيانات الرعاية الصحية الخام (Raw Data) لتقرير تفاعلي، يسهّل فهم وتتبع حالات الوفاة ومستوى الأداء العام للمستشفى.
أهم الأرقام والنتائج
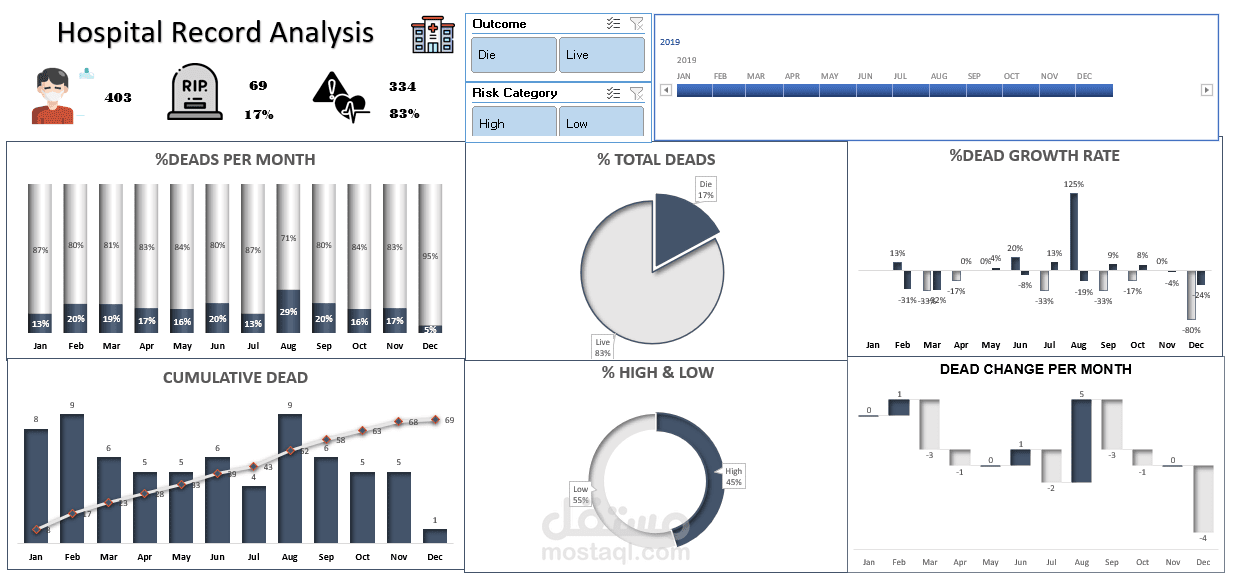
بعد تحليل 403 حالة، طلعت بالنتائج دي:
إجمالي الوفيات: 69 حالة (بنسبة 17%).
حالات النجاة: 334 حالة (بنسبة 83%).
توزيع المخاطر: تبين إن 45% من الحالات كانت "حرجة/عالية الخطورة"، بينما 55% كانت حالات "منخفضة الخطورة".
المميزات والرسوم البيانية (الـ Dashboard)
صممت لوحة بيانات (Dashboard) بتشمل أدوات متطورة لمراقبة الأداء:
نسبة الوفيات الشهرية: لمقارنة عدد الوفيات بالناجين كل شهر.
مخطط الشلال (Waterfall Chart): عشان نراقب التغير الزيادة والنقصان في حالات الوفاة شهر بشهر.
منحنى الوفيات التراكمي: رسم بياني يوضح تراكم الحالات على مدار سنة 2019 بالكامل.
فلاتر تفاعلية (Slicers): بتسمح لأي مستخدم إنه يفلتر التقرير بالكامل بضغطة واحدة بناءً على النتيجة (عاش/توفى) أو درجة الخطورة.
وصف البيانات
البيانات اللي اعتمدت عليها كانت بتشمل:
رقم الزيارة، تاريخ دخول المريض (خلال سنة 2019)، تصنيف حالة المريض (خطيرة أو بسيطة)، والنتيجة النهائية للحالة.
الأدوات اللي استخدمتها
Microsoft Excel: استخدمت الجداول المحورية (Pivot Tables) والمعادلات المتقدمة.
Data Visualization: صممت رسوم بيانية مخصصة (شلال، دائري، وتراكمي) عشان تكون الرؤية أوضح لصناع القرار.