Sales-Performance-Analysis-Dashboard
تفاصيل العمل
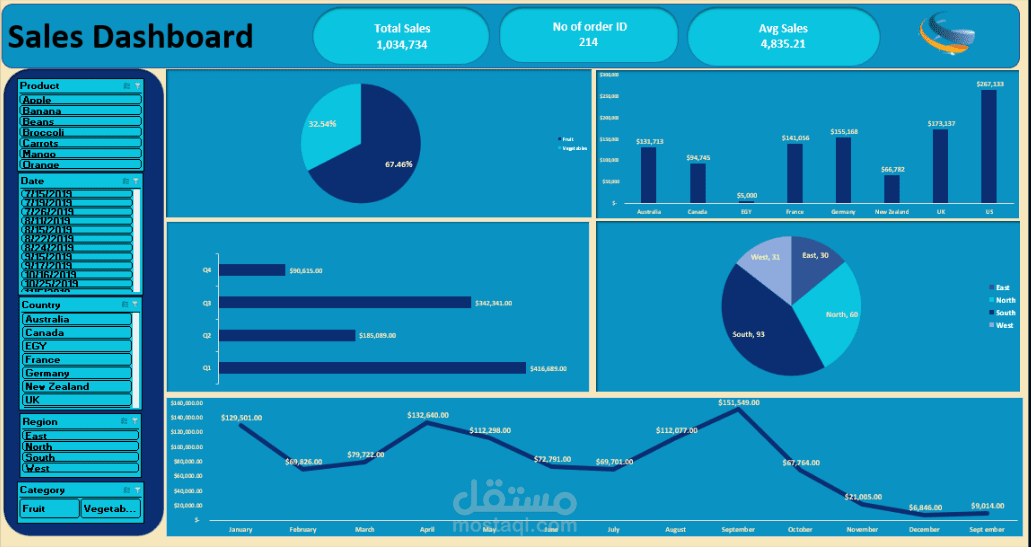
المشروع عبارة عن لوحة بيانات (Dashboard) لتحليل أداء المبيعات بشكل شامل. صممتها عشان أساعد أصحاب القرار والمستثمرين في الشركة يراقبوا الأداء العام ويحددوا فرص النمو في الأسواق المختلفة. التحليل بيركز على أرقام محورية زي إجمالي الإيرادات، عدد الطلبات، وتوزيع المبيعات على المناطق الجغرافية.
الأرقام والنتائج (KPIs)
الـ Dashboard بترصد 3 مؤشرات أساسية لحجم البزنس:
إجمالي مبيعاتنا: وصلت لـ 1,034,734 دولار.
حجم الطلبات: نفذنا 214 طلب.
متوسط قيمة الطلب: حوالي 4,835 دولار لكل أوردر.
المميزات والرسوم البيانية (Visualizations)
صممت مجموعة رسومات بيانية بتسهل قراءة البيانات:
توزيع المبيعات إقليمياً: "Pie Chart" بتوضح نصيب كل منطقة (شرق، شمال، جنوب، غرب) من المبيعات.
أفضل الدول أداءً: "Bar Chart" بتقارن الإيرادات بين دول زي (أمريكا، بريطانيا، ألمانيا، فرنسا، وكندا).
تحليل فئات المنتجات: مقارنة دقيقة بين مبيعات "الفاكهة" و"الخضروات".
تريند المبيعات: خط بياني (Line Chart) بيوضح تقلبات المبيعات الشهرية على مدار السنة.
فلاتر ذكية (Slicers): أضفت فلاتر تفاعلية تخليك تقدر تحلل البيانات بناءً على (السنة، النوع، الدولة، الربع سنوي، أو المنطقة) بضغطة واحدة.
هيكلة البيانات
البيانات اللي اعتمدت عليها بتشمل تفاصيل دقيقة لكل عملية بيع:
رقم وتاريخ الأوردر، نوع المنتج وصنفه (زي التفاح، الجزر، الموز)، تفاصيل جغرافية (الدولة والمنطقة)، والمبالغ المالية لكل حركات البيع.
المهارات التقنية اللي طبقتها
تنظيف البيانات (Data Cleaning): جهزت البيانات الخام وصفيتها عشان تكون جاهزة للتحليل الدقيق.
الجداول المحورية (Pivot Tables): لخصت آلاف البيانات في تقارير بزنس واضحة ومفهومة.
تصميم لوحات البيانات: ركزت على تجربة المستخدم (UI) من خلال إضافة عناصر تفاعلية زي الـ Slicers والـ Timeline عشان يكون التقرير سهل وسلس في الاستخدام.