Healthcare Dashboard
تفاصيل العمل

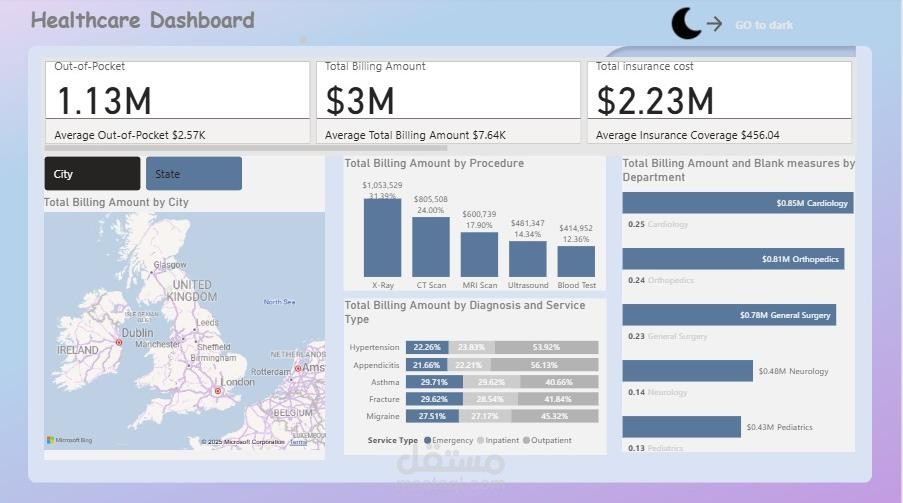
Overview
An interactive dashboard analyzing healthcare billing data to track patient costs, insurance coverage, and hospital service performance.
Key Insights
Total Billing: $3M | Insurance Coverage: $2.23M | Out-of-Pocket: $1.13M
Highest revenue-generating procedures: X-Ray and CT Scan
Top departments by billing: Cardiology, Orthopedics, General Surgery
Cost distribution analyzed by diagnosis and service type (Emergency, Inpatient, Outpatient)
Geographic view highlights billing by city
Tools Used
Power BI, DAX, Data Cleaning, Data Modeling
Business Value
Supports financial monitoring, resource planning, and data-driven healthcare decisions.