Maven Market – Sales Performance Dashboard
تفاصيل العمل
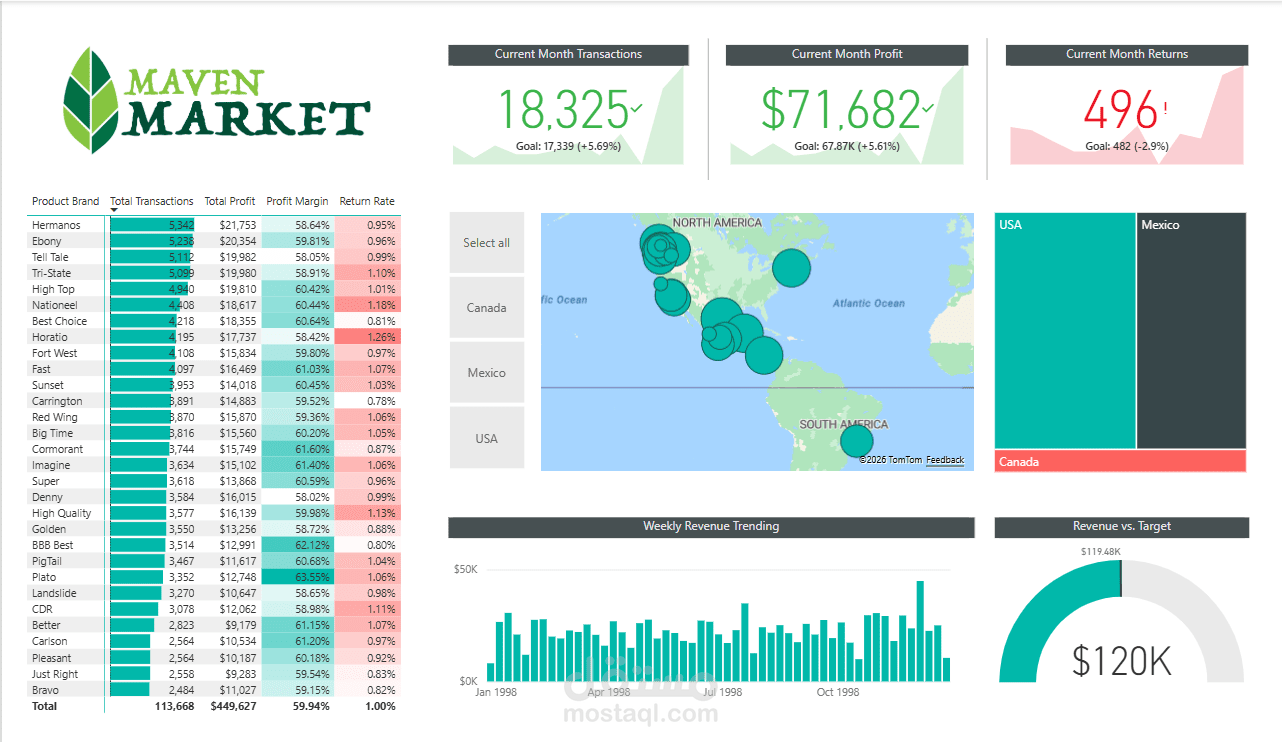

This project presents an interactive Power BI dashboard for analyzing the sales performance of Maven Market.
The dashboard provides a clear overview of transactions, profit, returns, and revenue trends across different product brands and regions.
It is designed to support data-driven decision-making by highlighting key KPIs, geographic performance, and weekly revenue patterns.
? Business Objectives
Monitor current month performance against targets
Analyze profit and return rates by product brand
Compare revenue trends over time
Understand regional performance across North America
Identify high-performing and underperforming brands