Sales Performance Analysis & Dashboard — Misuo Furniture
تفاصيل العمل
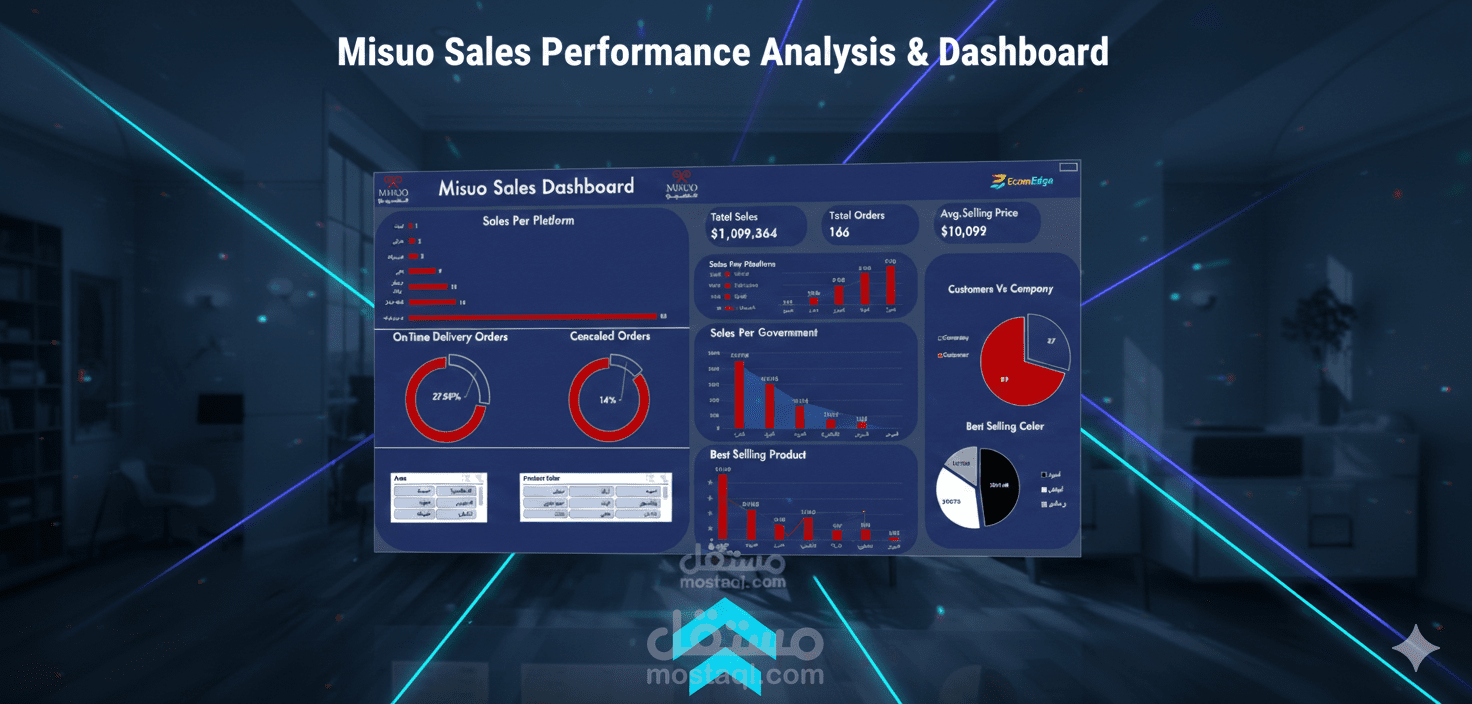
Sales Performance Analysis & Dashboard — Misuo Furniture----
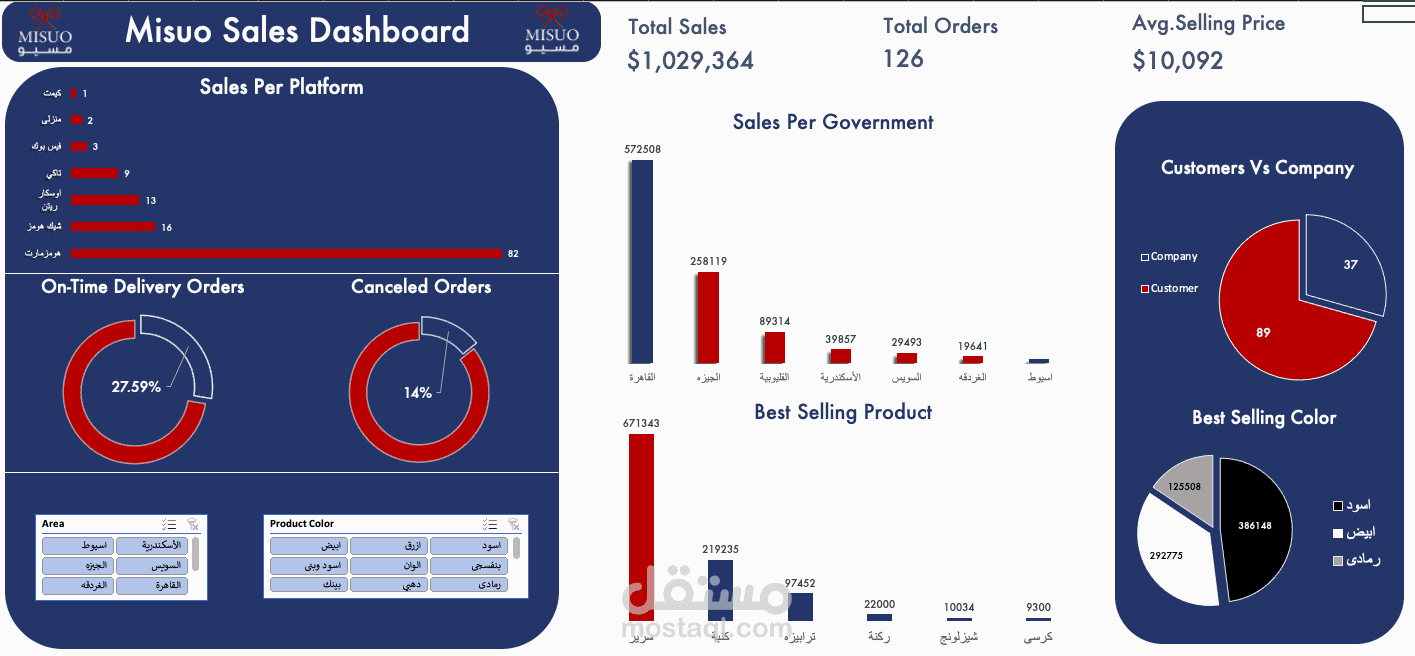
This project analyzes sales performance for Misuo Furniture to provide clear visibility into revenue trends, product performance, and sales distribution across different categories. The goal was to transform raw sales data into an interactive and easy-to-understand dashboard that supports better business decisions.
Business Problem--
The company needed a centralized view of sales performance to identify top-performing products, track revenue trends, and detect areas with declining performance. Existing data was stored in raw tables, making analysis slow and decision-making difficult.
-Dataset
The dataset contains real sales data including product categories, sales amounts, dates, and regional performance metrics.
Tools Used-
Microsoft Excel
Pivot Tables & Pivot Charts
Data Cleaning & Transformation
KPI Design--
Dashboard Layout & Visualization
Analysis Process
Cleaned and organized raw sales data
Created calculated KPIs for revenue and performance tracking
Analyzed sales trends over time
Compared category and product performance
Designed a dashboard for quick business insights
Key Insights--
A small number of products generated the majority of total revenue.
Certain months showed consistent sales peaks, indicating seasonal demand.
Some product categories underperformed despite high inventory presence.
Business Recommendations
Focus marketing efforts on top-performing product categories.
Optimize inventory for slow-moving products.
Use seasonal trends to plan promotions and stock levels.
Future Improvements--
Automate data updates using Power Query connections.
Connect dashboard to a SQL database for real-time reporting.
Add forecasting to predict future sales trends.