Mortgage Trade Analysis & Execution Dashboard
تفاصيل العمل

This Project contains a comprehensive Mortgage Secondary Market Analysis solution developed in Power BI. The project automates the evaluation of mortgage trade executions by comparing counterparty bids against market benchmarks (UMBS), calculating portfolio profitability, and identifying risk factors through borrower segmentation.
The dashboard monitors a $1.52bn portfolio, achieving a $11.7M Gross Profit while providing real-time visibility into trade-readiness and bid performance.
Technical Workflow
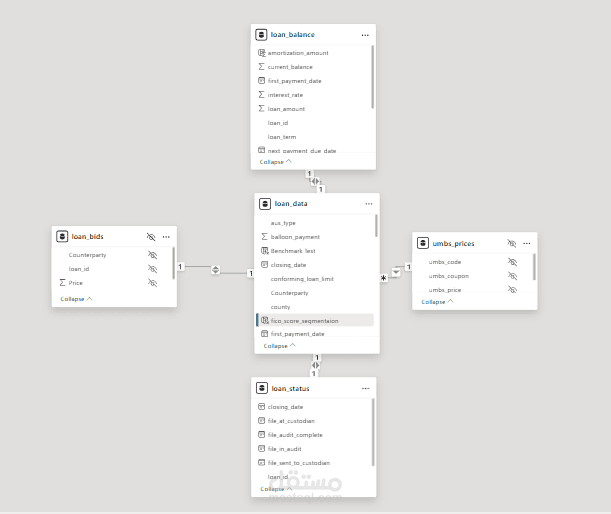
Data Architecture
The project follows a Star Schema design, utilizing five core tables: loan_data, loan_status, loan_balance, loan_bids, and umbs_prices.
1. Data Engineering & ETL (Power Query)
The model processes five core tables: loan_data, loan_status, loan_balance, loan_bids, and umbs_prices.
Best Execution Logic: Transformed the loan_bids table to programmatically identify the highest price offered per loan and the corresponding winning counterparty.
Data Enrichment: Merged loan_data with umbs_prices using umbs_code to establish market benchmarks and linked with winning bids for valuation.
Cleaning: Performed error replacement and column optimization to ensure a high-performance data model.
2. Advanced Financial Modeling (DAX)
The project utilizes sophisticated DAX logic to simulate mortgage accounting and trade performance:
Amortization Engine: Derived the principal portion of payments and scheduled balances using the PPMT function
Risk Segmentation: Created a dynamic FICO score classification (e.g., "Below 650" to "Above 723") to analyze pricing variance across credit tiers.
Operational Tracking: Built nested logic to evaluate trade_status, tracking loans through audit and custodial milestones until they are "Ready to Trade."
? Dashboard Analysis
? Interactive Dashboard Previews
To demonstrate the dynamic nature of the model, the following animations showcase the report's interactivity and AI capabilities.
1. Trade Execution & Best Execution Logic
This view demonstrates how the dashboard filters across different counterparties—such as Storgan Manley (holding 40.78% of bids) and Bank of Americans—to evaluate trade premiums and benchmark test results.
2. AI-Driven Key Influencers
This section highlights the integration of machine learning within Power BI. The Key Influencers visual identifies that a median FICO score above 723 is the primary driver, increasing the average price by 0.79.
Tab 1: Trade Execution Performance
Focuses on counterparty bidding activity and benchmark testing.
Weighted Average (WA) Price: Currently tracking at 98.32.
Benchmark Test: Logical check determining if trade price exceeds the UMBS market price.
Accepted Bids: Visualization of winning volumes for firms like Storgan Manley (40.78% of bids) and Bank of Americans.
Tab 2: Profit Analysis & AI Insights
Evaluates the financial health and risk-based pricing of the portfolio.
Profitability KPIs: Monitors Gross Profit ($11.7M) and Profit Margin (0.771%) against a 5% target.
AI Key Influencers: Utilizes Power BI's AI engine to determine that FICO scores > 723 are the primary driver for price increases.
Revenue Segmentation: Identifies performance gaps, specifically showing how revenue drops in the "Below 650" FICO segment.
? Tools Used
Power BI Desktop: Report authoring and AI visuals.
Power Query: ETL pipelines and data modeling.
DAX: Financial modeling and custom measure development.