Sales Dashboard (Excel)
تفاصيل العمل
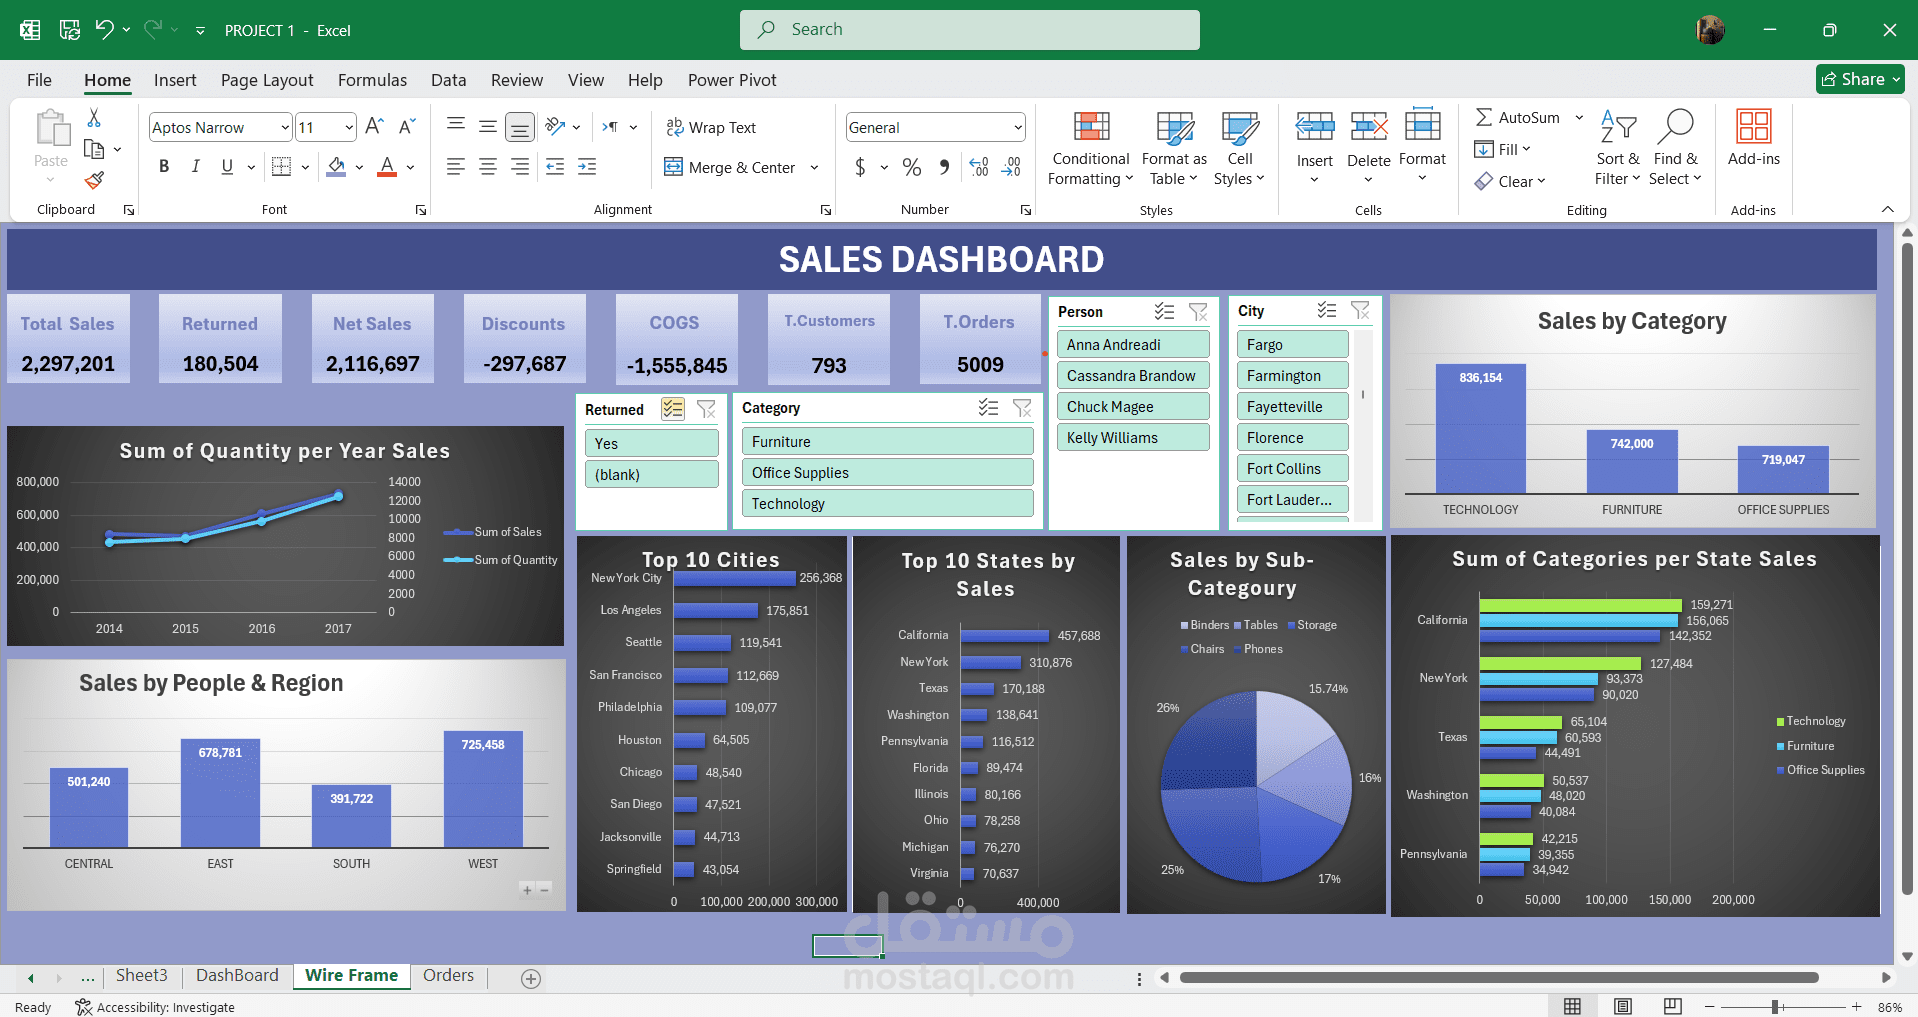
This project presents a comprehensive Sales Dashboard built entirely in Microsoft Excel, designed to analyze and monitor sales performance in a clear, interactive, and data-driven way.
The dashboard provides a high-level overview of key business KPIs, including:
Total Sales
Net Sales
Returned Sales
Discounts
Cost of Goods Sold (COGS)
Total Customers
Total Orders
It also includes detailed analytical visuals such as:
Sales trends over time (Yearly Sales & Quantity).
Sales distribution by Category and Sub-Category.
Performance analysis by Region, State, City, and Salesperson.
Top 10 Cities and States by Sales.
Category-wise sales comparison across different states.
The dashboard is fully interactive, using slicers and filters (Category, City, Person, Returned status) to allow dynamic exploration of the data and support better decision-making.