HR Dashboard
تفاصيل العمل
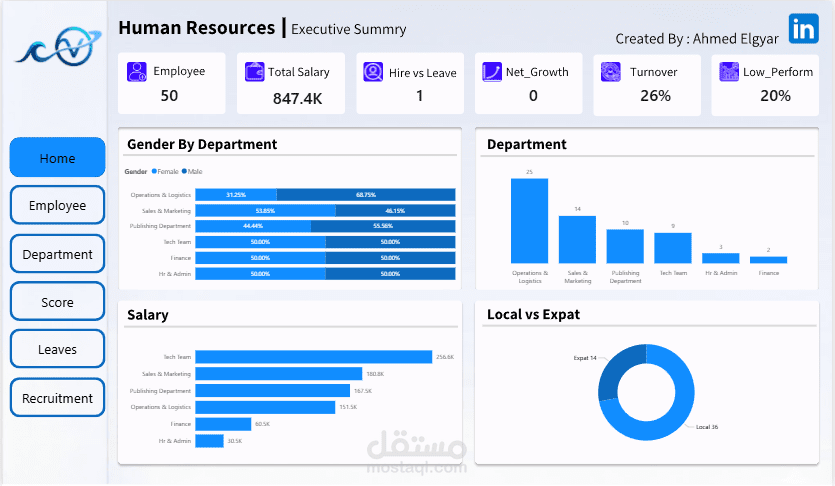

This project is a sophisticated HR Analytics solution designed to transform raw workforce data into actionable executive insights. It bridges the gap between high-end UI/UX design and deep data engineering. By integrating a custom interface designed in Figma with a powerful analytical engine in Power BI, the dashboard provides a 360-degree view of organizational health, focusing on retention, recruitment efficiency, and compensation structures.
? Technical Core (Advanced DAX & Data Modeling)
The project’s "brain" is built on a robust data model powered by over a hundred Custom DAX Measures to ensure real-time accuracy for complex KPIs:
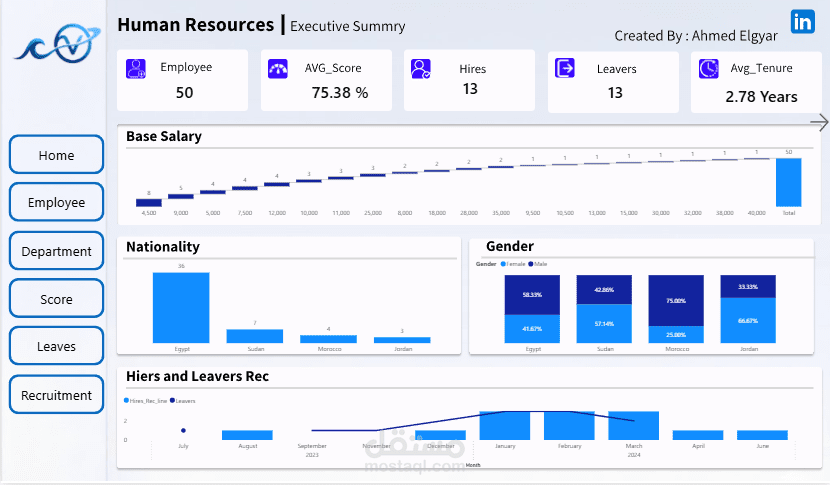
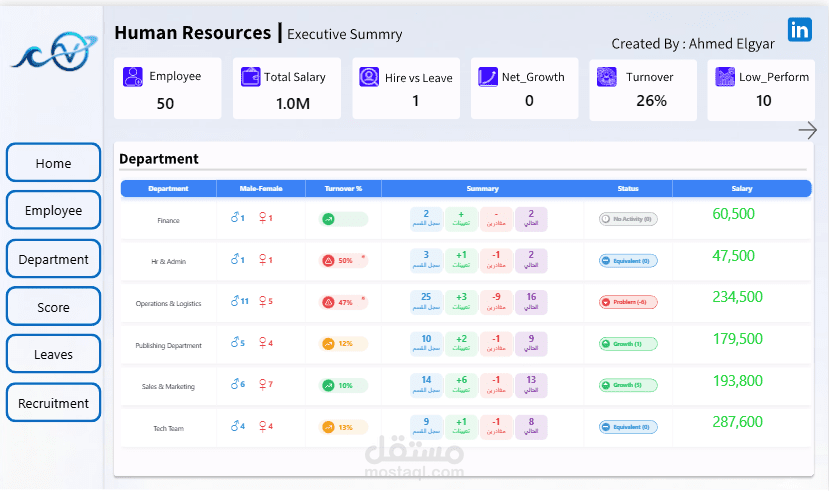
Retention & Turnover Analysis: Engineered advanced measures to calculate Turnover Rate (26%), Net Growth, and Average Tenure (2.78 Years) to monitor workforce stability.
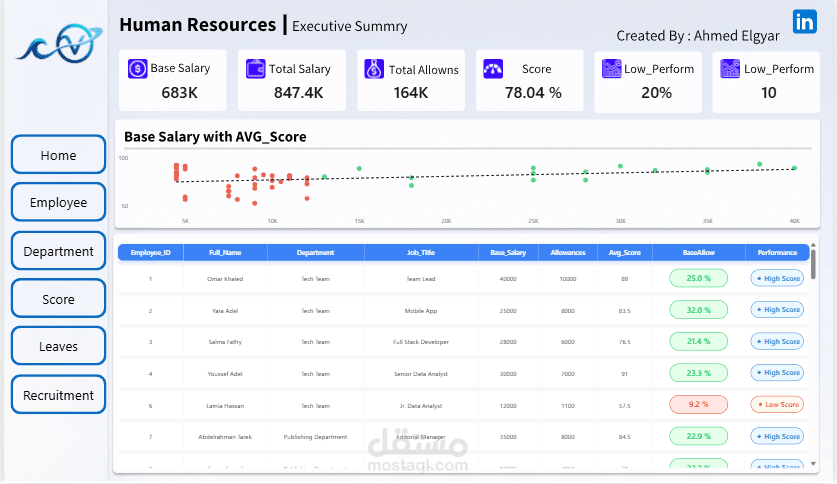
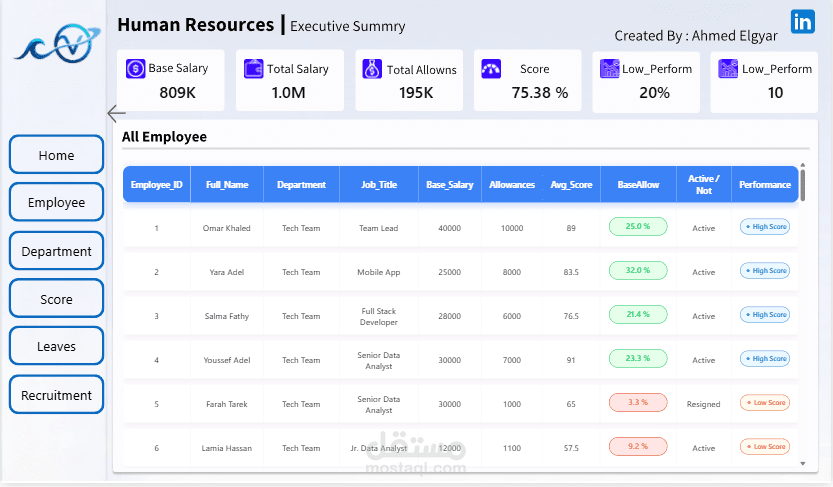
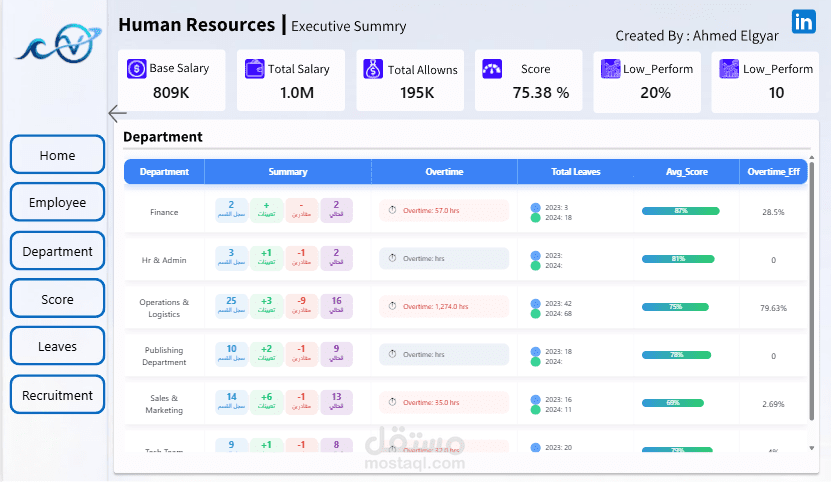
Compensation Engineering: Developed formulas to analyze the ratio between Base Salary vs. Allowances and mapped salary distribution across departments, totaling $1.0M in payroll.
Performance Correlation: Created a scoring system (Avg_Score) to identify Low Performers (20% of staff) and correlated their performance with salary brackets using scatter plots.
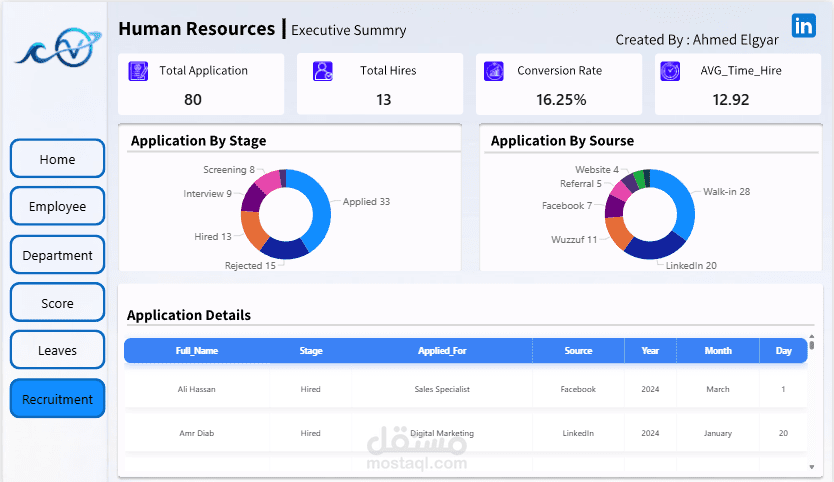
Recruitment Funnel Metrics: Tracked the entire hiring lifecycle, calculating Conversion Rates (16.25%) and Average Time to Hire (12.92 days) across multiple sources like LinkedIn and Referrals.
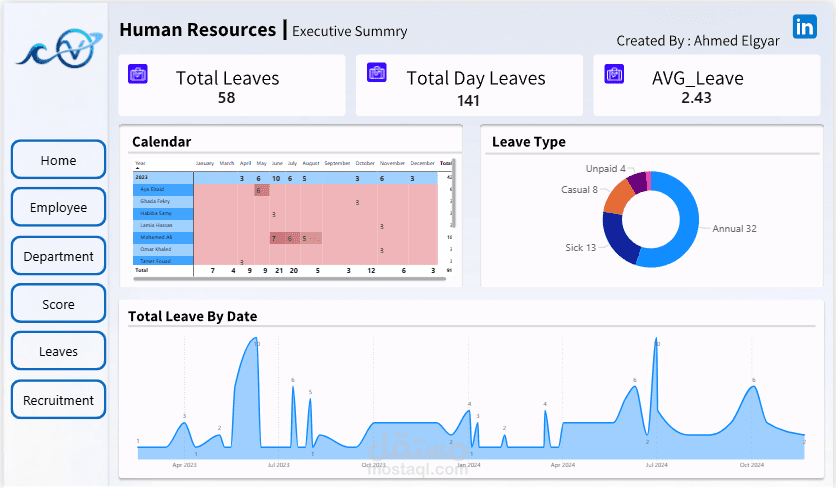
Operational Efficiency: Built measures for Overtime Efficiency and a dynamic Leave Management System that tracks types (Sick, Annual, Casual) and impact on productivity.
Conditional Logic: Leveraged DAX for dynamic formatting (e.g., salary_color) to visually flag anomalies in payroll or performance automatically.
? Design & User Experience (UI/UX)
Figma Prototyping: Unlike standard templates, the entire layout, sidebar navigation, and color palette were custom-built in Figma for a sleek, corporate "SaaS-style" feel.
Data Storytelling: Organized into logical modules (Executive Summary, Employee Detail, Recruitment, and Leaves) to allow users to move from high-level KPIs to granular details seamlessly.
Demographic Insights: Visualized workforce diversity through Nationality, Gender distribution (58% Male / 42% Female in key areas), and Local vs. Expat ratios.
? Tools & Competencies:
Business Intelligence: Power BI (Data Modeling, Advanced DAX, Power Query).
Design: Figma (Interface Design, Wireframing).
Analytics: HR KPI Frameworks, Financial Modeling, Recruitment Tracking.