Sales Dashboard
تفاصيل العمل

Project: Operations & Sales Intelligence Hub (Figma + Power BI)
Executive Summary
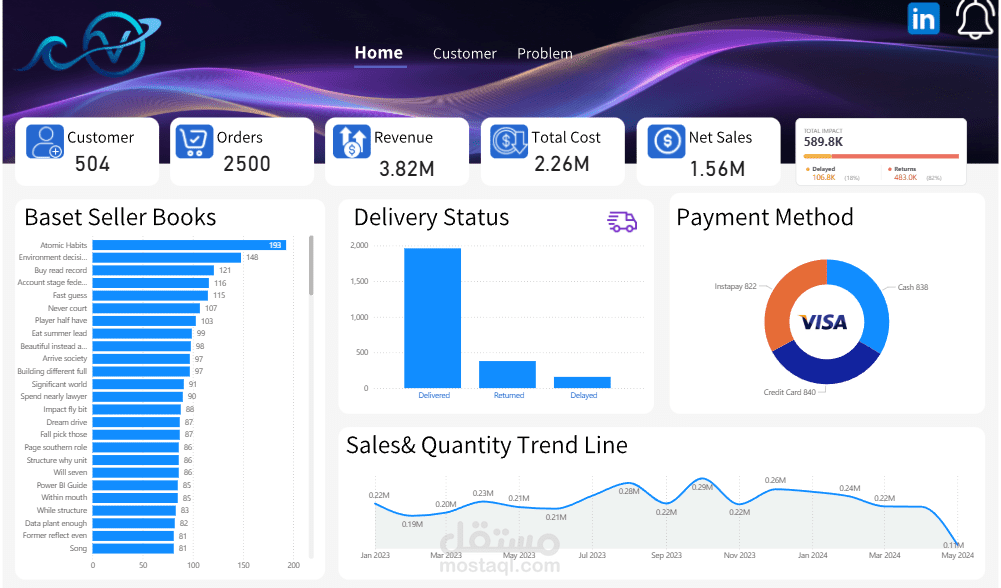
A dual-phase project involving UI/UX prototyping in Figma and advanced data engineering in Power BI. The dashboard transforms complex operational datasets into a streamlined interface to track $3.8M in revenue and identify critical logistics bottlenecks.
Technical Implementation & DAX Measures
Developed a robust data model using DAX (Data Analysis Expressions) to move beyond basic aggregates and provide deep-dive insights:
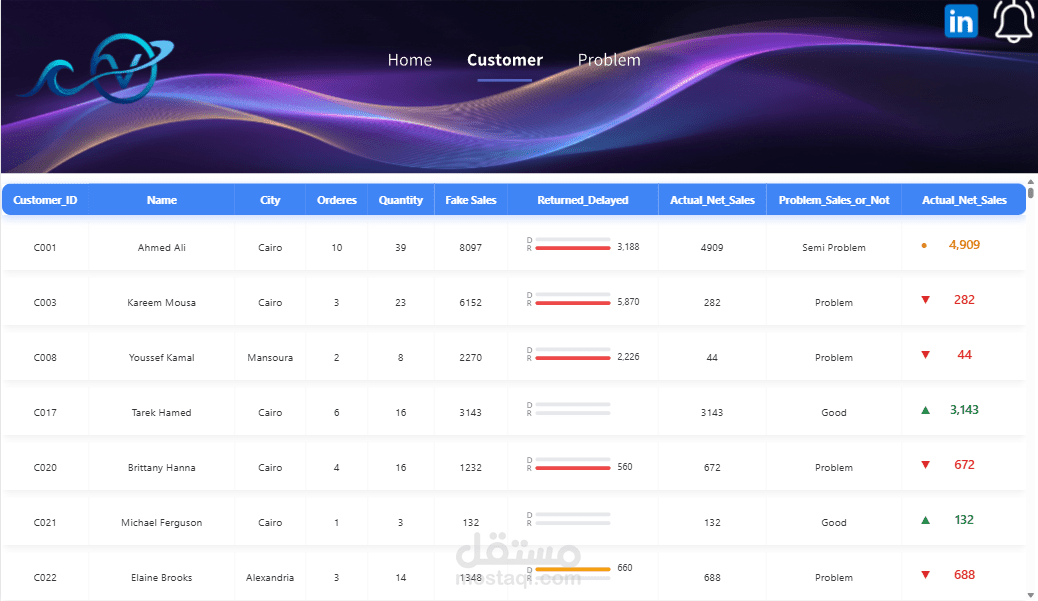
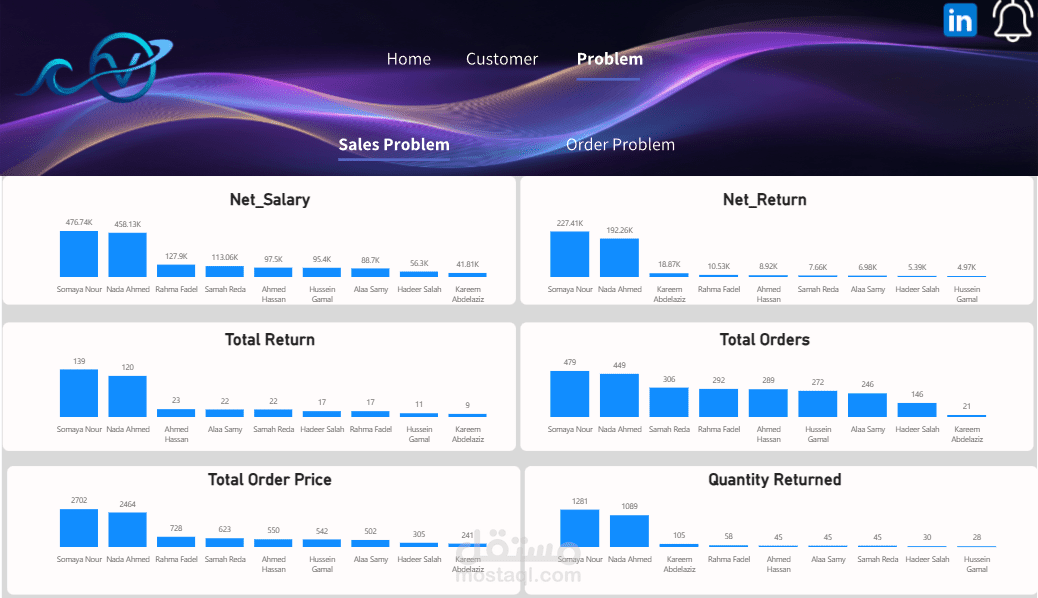
Net Performance Logic: Engineered DAX measures to calculate Actual Net Sales by subtracting returns and delayed order impacts from gross revenue.
Dynamic Status Categorization: Created complex SWITCH and IF logic to automatically classify customer health (e.g., "Good," "Semi-Problem," "Problem") based on return rates and order frequency.
Time-Intelligence Analytics: Utilized DAX to visualize a 17-month Sales & Quantity Trend Line, identifying seasonal peaks and performance dips.
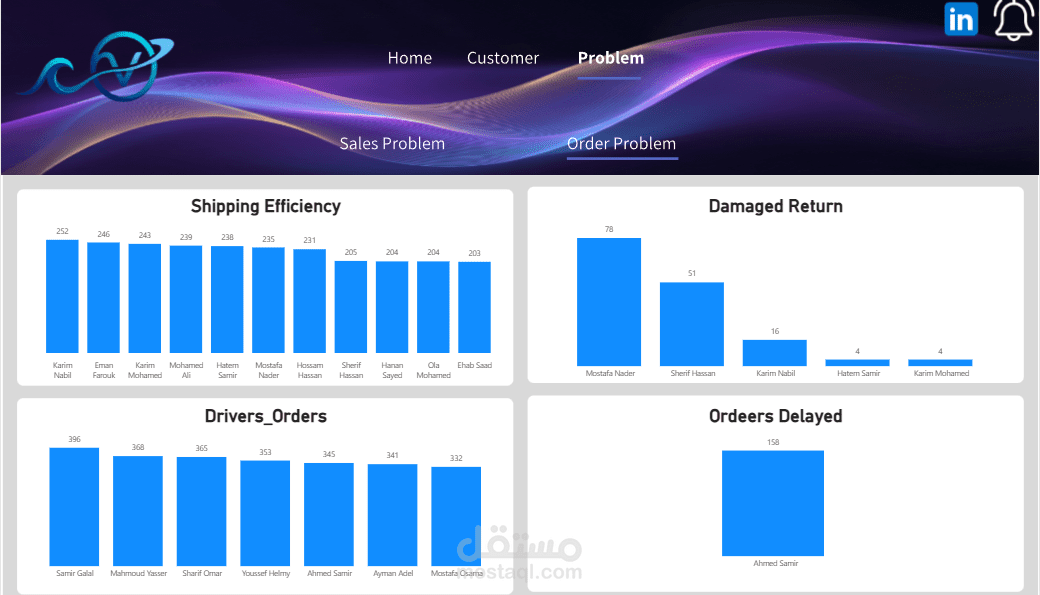
Operational Loss Tracking: Built measures to quantify the Total Impact of shipping delays, pinpointing specific drivers responsible for significant delivery failures (e.g., 158+ delayed orders).
Design & Visualization (Figma)
Designed a high-fidelity Dark-Theme UI in Figma to ensure high contrast and readability.
Implemented a custom Navigation System to allow stakeholders to toggle between Executive, Customer, and Operational "Problem" views seamlessly.
Key Results
Isolated the specific root causes for 82% of returns, enabling data-driven inventory decisions.
Streamlined the monitoring of 504 unique customers and 2,500+ orders through a single interactive portal.