pizza place project data analysis
تفاصيل العمل

? **Pizza Sales Analysis Project**
I recently completed a sales analysis project focused on exploring pizza sales data to uncover key trends, customer behavior, and revenue drivers.
? **Approach**
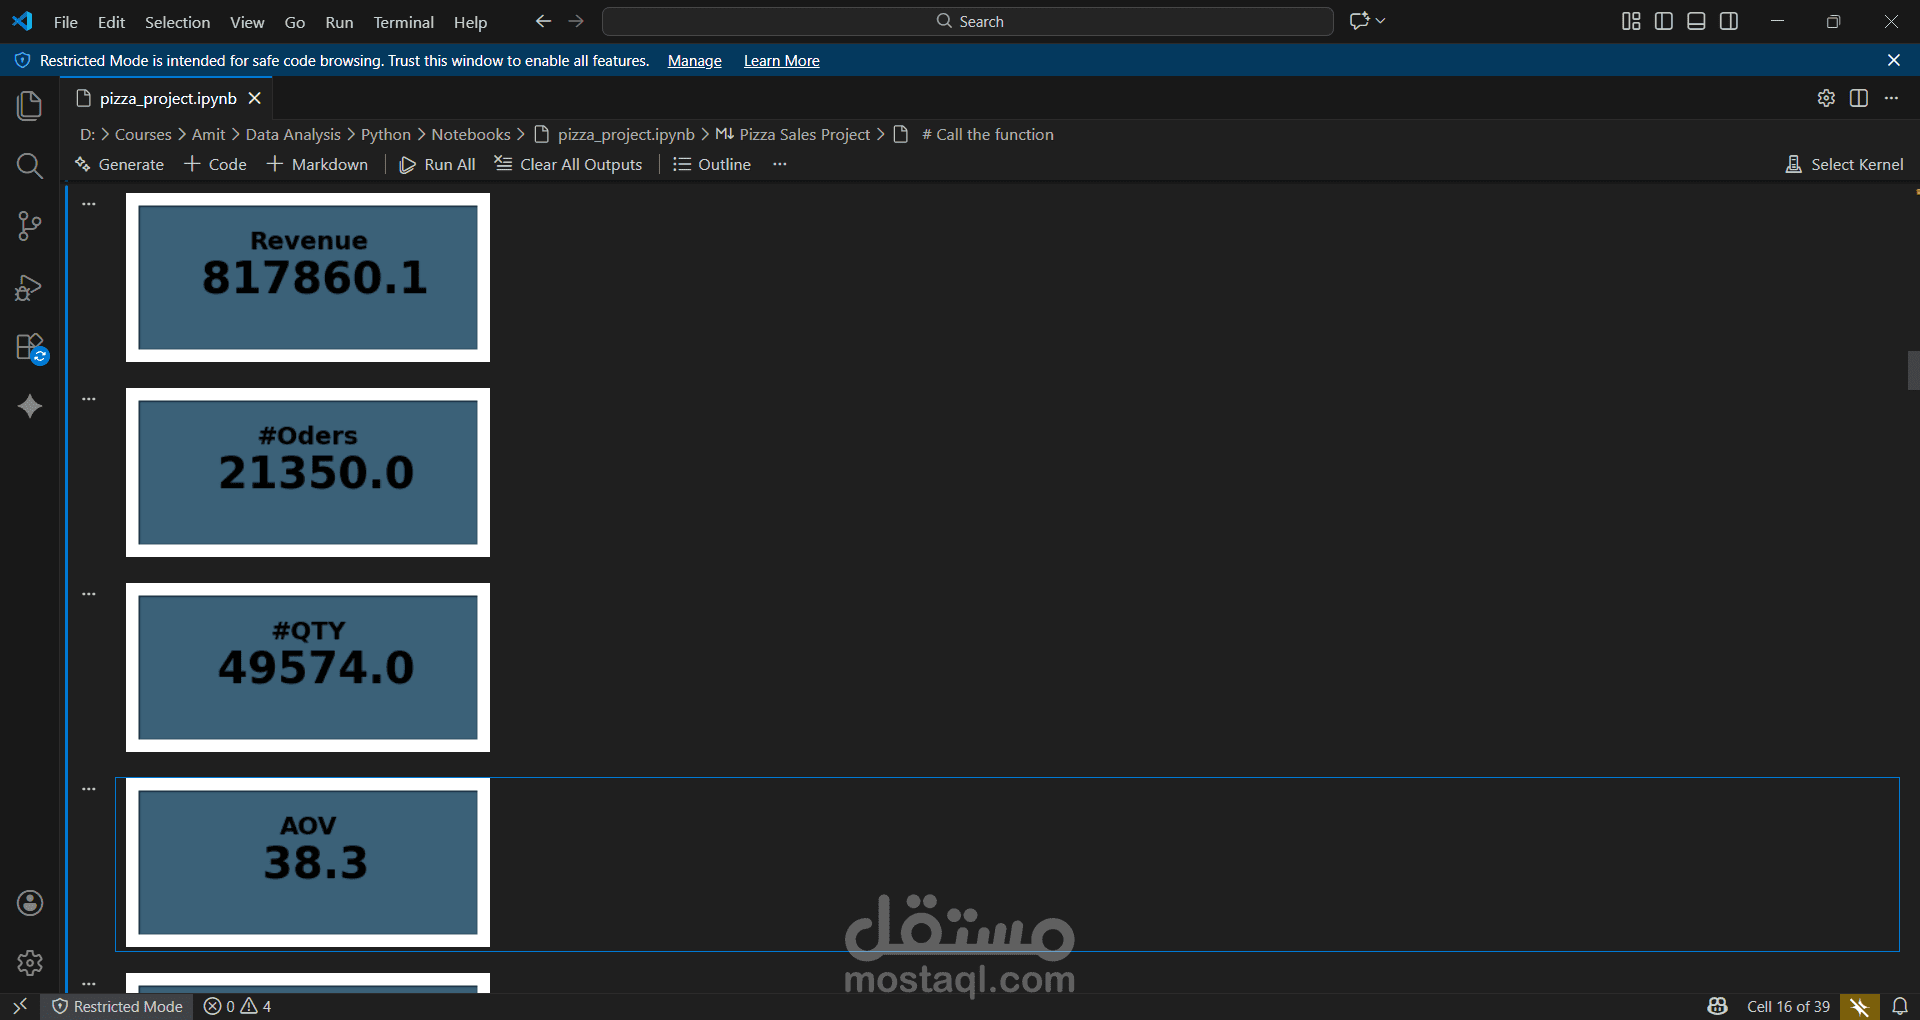
I imported, cleaned, and prepared raw data using **Pandas** and **NumPy**, then designed and calculated essential KPIs, including:
* Total Revenue
* Total Orders
* Total Quantity Sold
* Average Order Value (AOV)
* Average Pizzas per Order
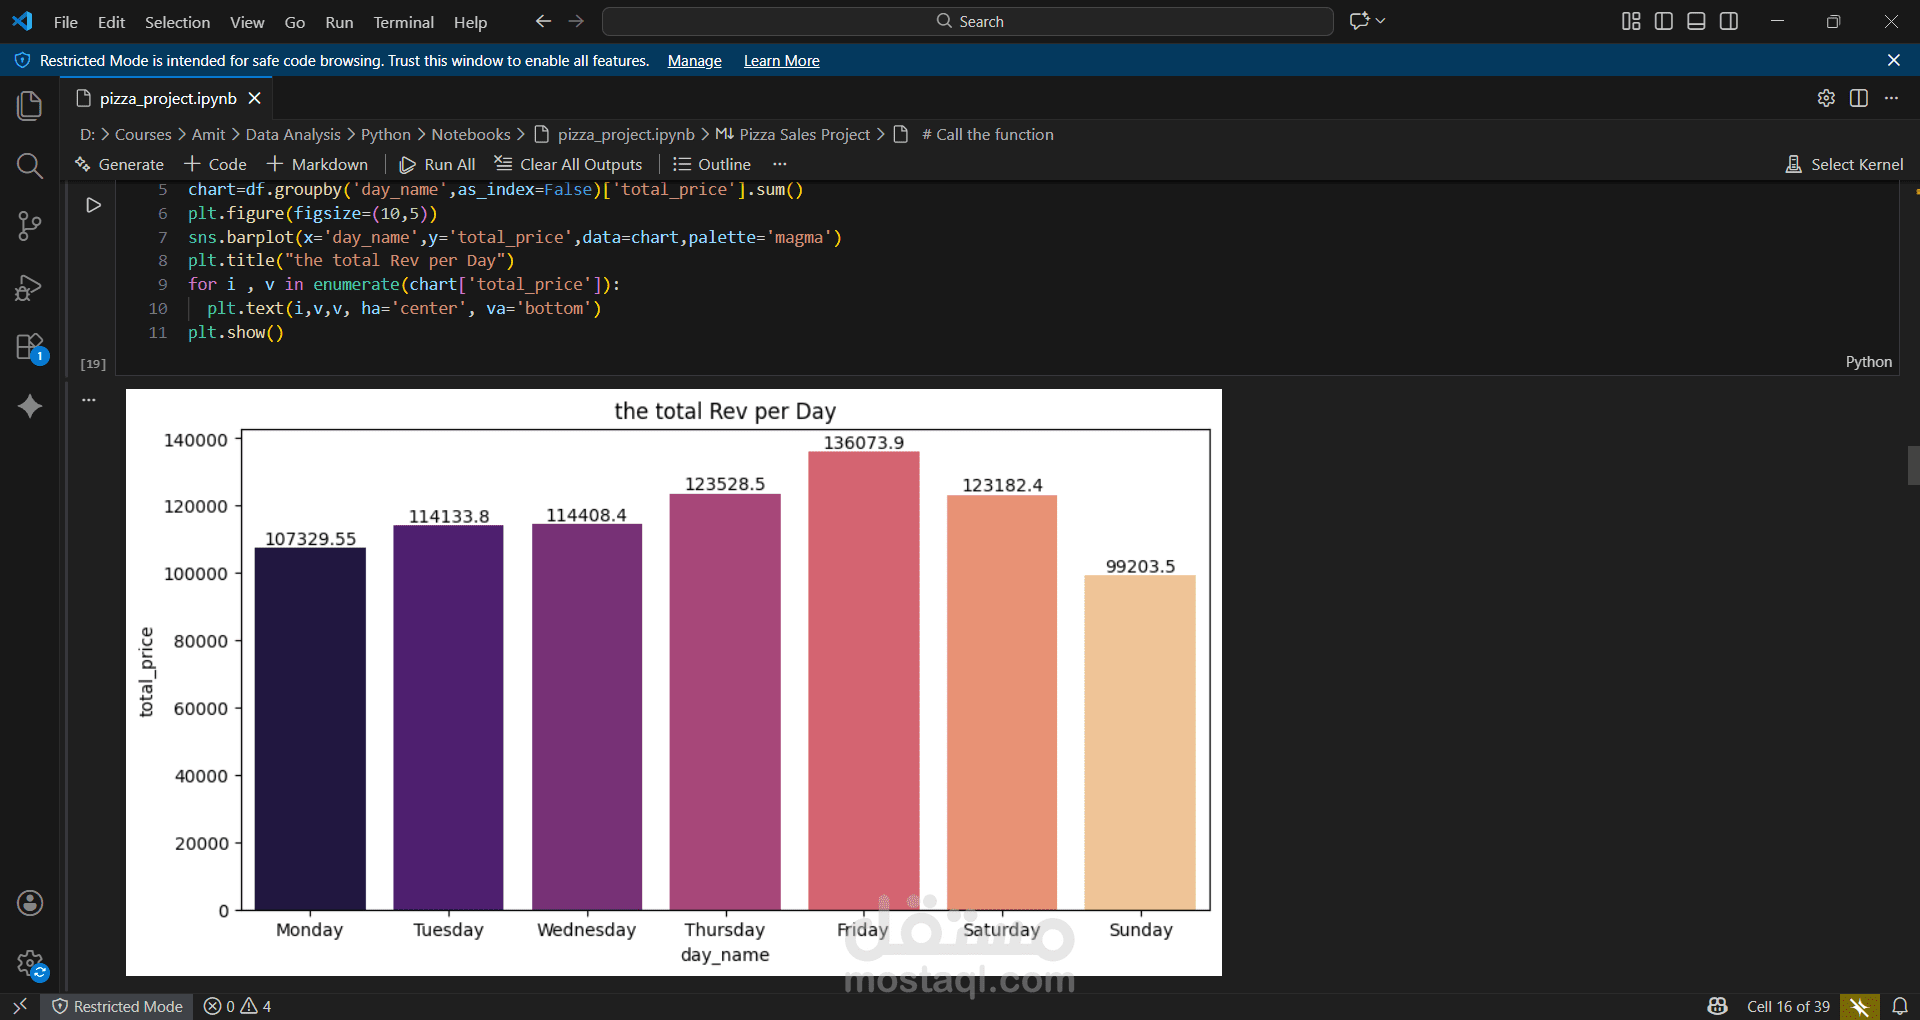
To communicate insights effectively, I built visualizations using **Matplotlib** and **Seaborn**, covering:
* Time-based sales trends
* Category-wise performance analysis
* Top and bottom-selling pizzas
* KPI summary visuals for quick decision-making
? **Key Insights**
* A small number of categories generate the majority of total revenue
* Order size patterns reveal clear customer preferences
* Visual dashboards help identify product focus areas and growth opportunities
? **Tech Stack**
Python | Pandas | NumPy | Matplotlib | Seaborn | Data Cleaning | Exploratory Data Analysis (EDA)
This project strengthened my ability to transform raw data into actionable, business-ready insights and present them through clear, impactful visuals.
I’m excited to apply these skills to larger and more complex datasets ?