super store data analysis
تفاصيل العمل
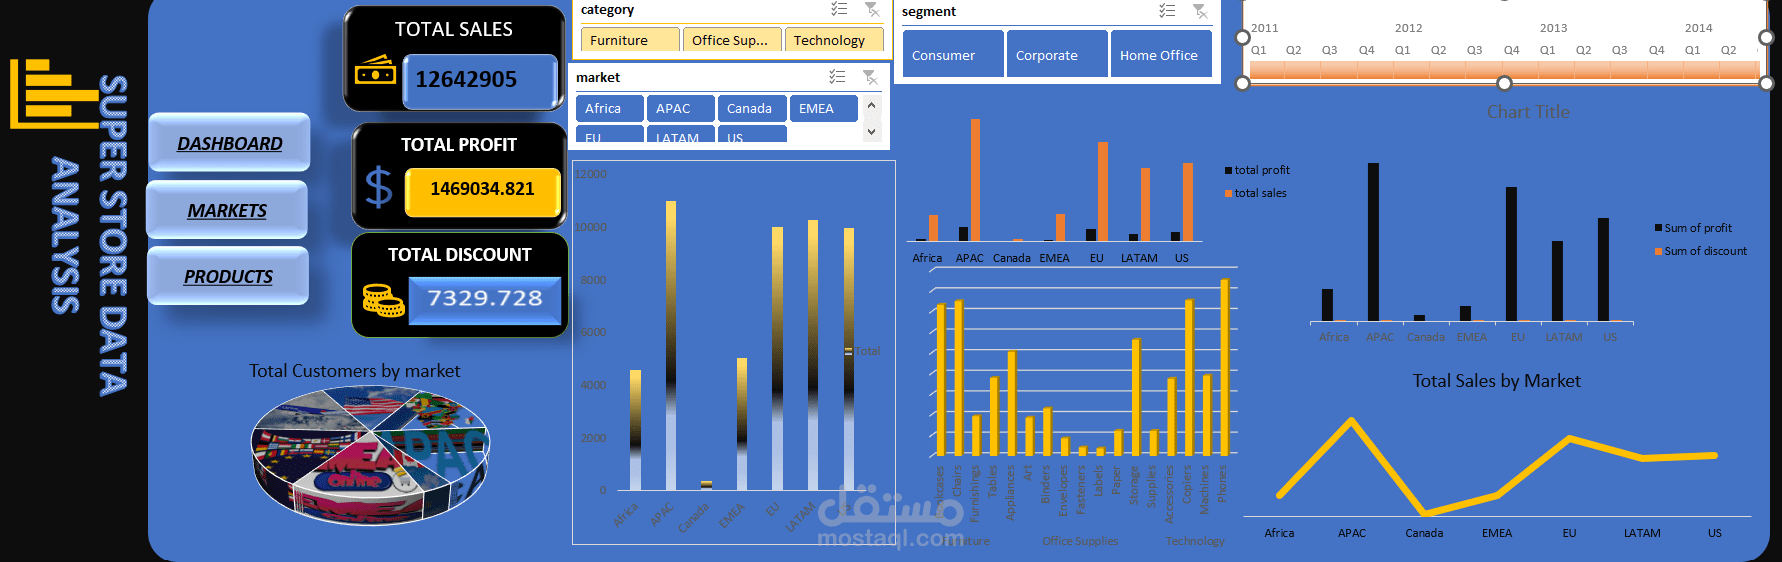
? Super Store Data Analysis Dashboard
I’m excited to share my latest Excel dashboard for Super Store data analysis, designed to transform raw data into clear, actionable insights.
? Key highlights include:
? Total Sales, Total Profit, and Total Discount KPIs
? Performance analysis by Market (Africa, APAC, EMEA, US, etc.)
?️ Sales & Profit comparison by Category and Segment
? Time-based analysis using interactive Timelines & Slicers
? Data-driven insights to support better business decisions
? Objective:
To provide a comprehensive and interactive view of business performance, helping stakeholders identify top-performing markets, profitable categories, and the impact of discounts on profitability.
I’d really appreciate your feedback and suggestions ?
If you’re interested in the file or the step-by-step build process, feel free to reach out