Power BI Dashboard | Registration Indicators
تفاصيل العمل

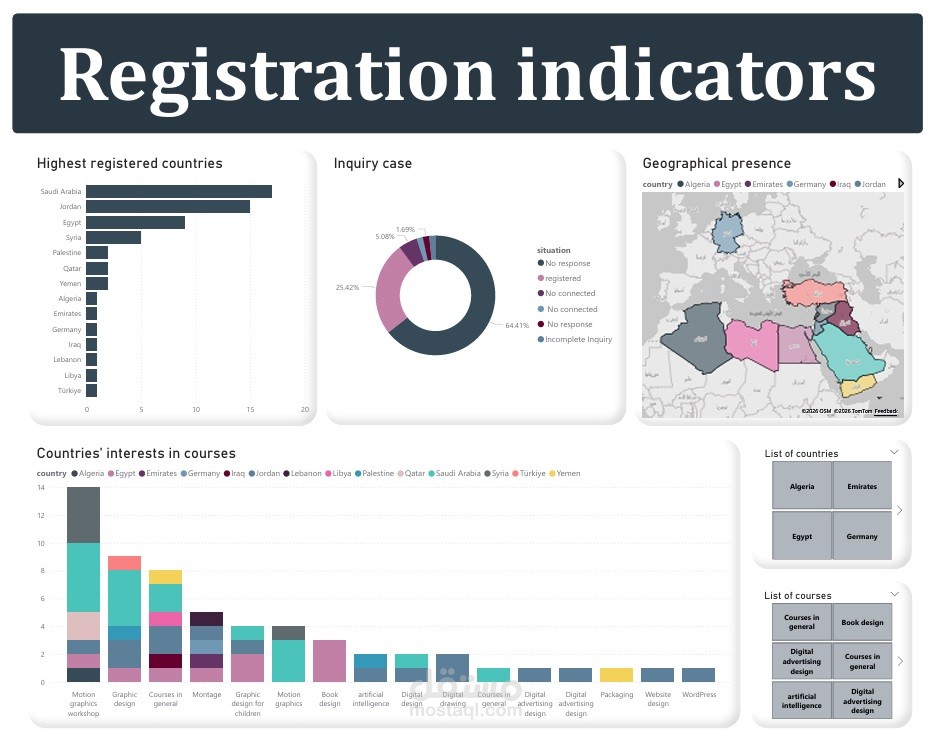
This dashboard analyzes registration data to identify geographic patterns, inquiry status distribution, and course demand across different countries.
Through this project, I focused on transforming raw data into clear insights that support better understanding of user behavior and regional trends.
? Key Insights:
Noticeable variation in inquiry completion rates across countries.
Certain courses show stable interest regardless of geographic location.
Geographic analysis highlights regions with concentrated demand that may require targeted strategies.
? Tools & Skills Applied:
Power BI | Data Modeling | Data Visualization | Data Cleaning | Basic DAX | Analytical Thinking
This project is part of my continuous learning journey in data analytics, and I’m always open to constructive feedback and suggestions for improvement.