Directors High Level Dashboard
تفاصيل العمل
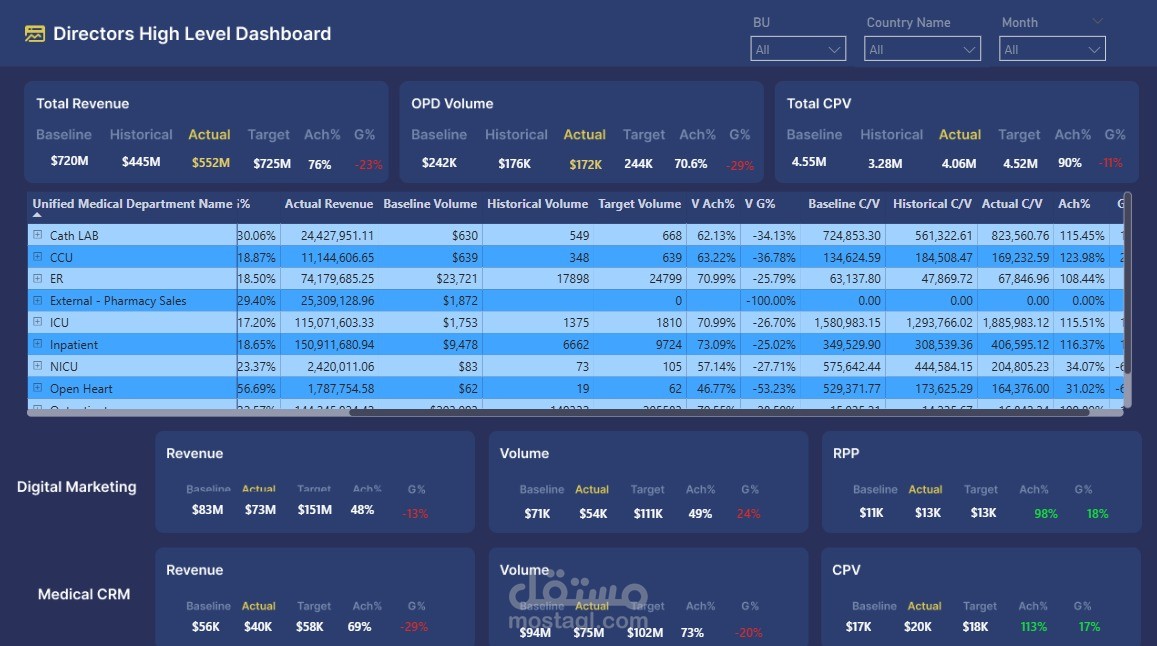
Designed and developed an interactive Power BI dashboard to provide executive leadership with real-time visibility into sales and operational performance across multiple business units. The dashboard integrates data from three key sources—Billing, Digital Marketing, and Medical CRM—originally stored in Excel.
Key Responsibilities & Deliverables:
Imported, cleaned, and transformed raw data using Power Query (handled missing values, deduplication, data type alignment, and table merging).
Built a robust data model in Power BI by establishing logical relationships between fact and dimension tables.
Created critical DAX measures, including:
Ach% = DIVIDE(Actual, Target)
G% = DIVIDE(Actual - Baseline, Baseline)
Developed a visually consistent and user-friendly dashboard featuring:
Dynamic slicers (Country, Business Unit, Month, Payment Type)
KPI cards for Revenue, Volume, CPV, and RPP
Detailed performance tables for OPD, IPD, Credit, Cash, Digital Marketing, and Medical CRM
Ensured brand-aligned visuals using a color picker tool to match the client’s design guidelines.