Coffee-Shop-Sales
تفاصيل العمل

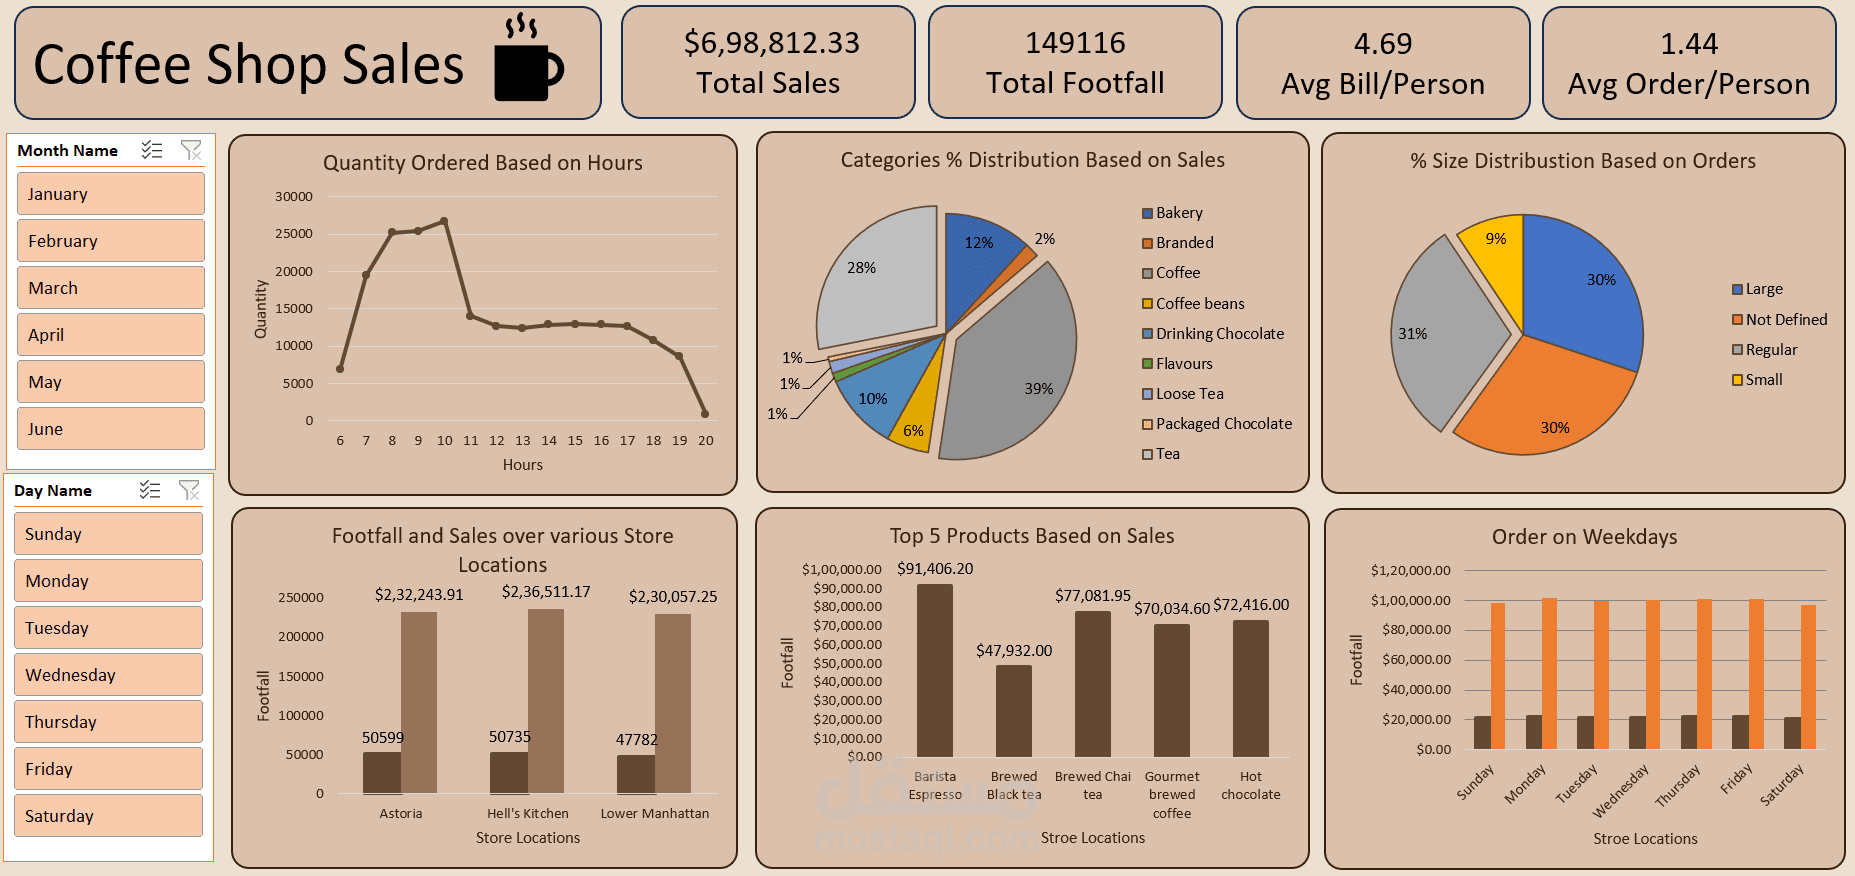
This project analyzes sales transactions from a coffee shop chain. It uses Excel with Power Query and Power Pivot to clean, transform, and visualize the data. The dashboard highlights sales performance by product, store, and time, helping to identify customer preferences and business trends.