Excel Project – Sales Dashboard
تفاصيل العمل
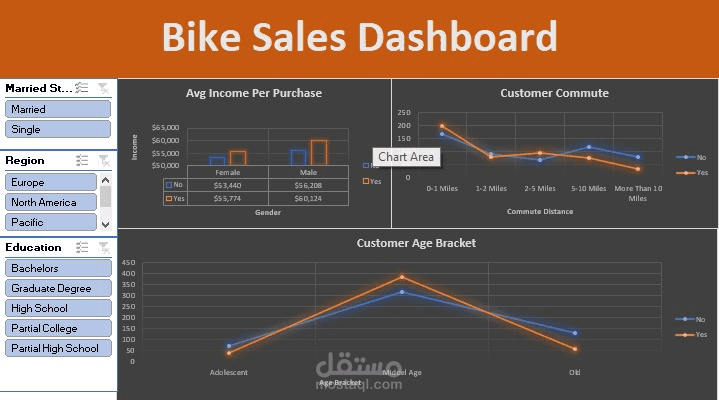
This project showcases a sales data analysis using Microsoft Excel. The data was cleaned and visualized using Pivot Tables, Slicers, and Charts to build an interactive dashboard that helps explore sales by region, product category, and discount level.