Power BI – Financial Performance Analysis Dashboard
تفاصيل العمل
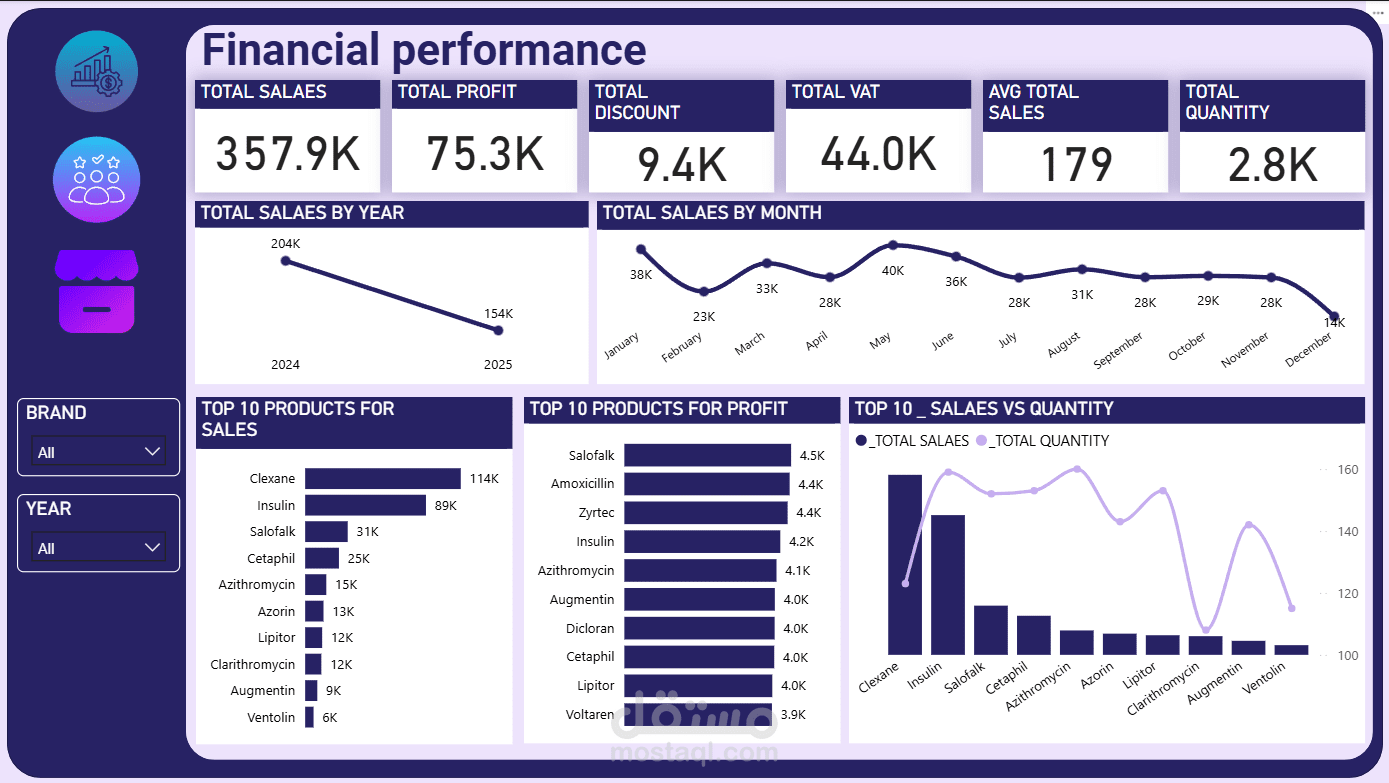
This Power BI project analyzes financial performance by turning raw data into interactive visuals and KPIs. I cleaned and transformed the dataset in Power Query, created a data model, and used DAX to calculate metrics such as revenue, profit, margin, VAT, cost and discount. The dashboard reveals trends by month, top-performing categories and cost patterns, helping decision-makers understand financial health and act faster.