amazon sales data analysis
تفاصيل العمل
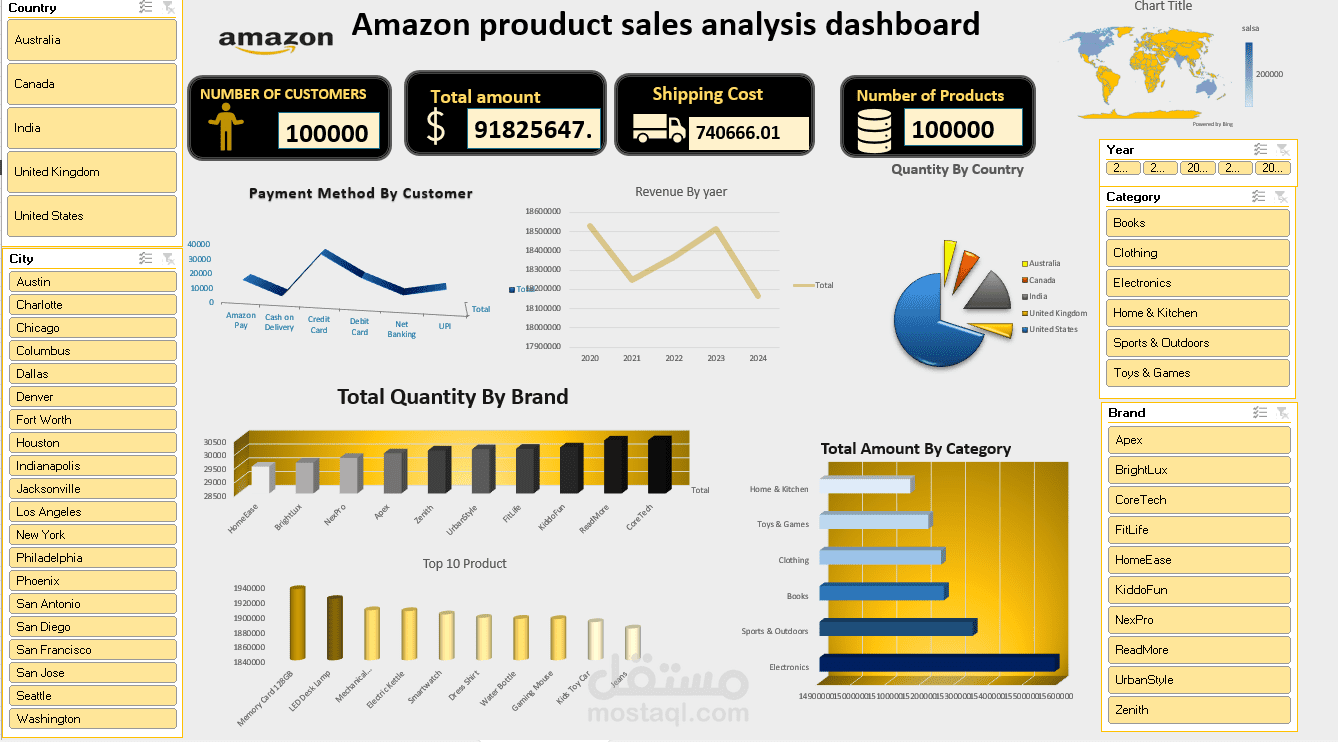
Sales performance analysis across multiple countries and cities
Key KPIs: Total Sales, Number of Customers, Number of Products, and Shipping Cost
Revenue trend analysis by year
Sales distribution by category, brand, and country
Top 10 products based on total sales
Interactive slicers for Year, Country, City, Category, and Brand
? Tools used:
Microsoft Excel
Power Query for data cleaning and transformation
Power Pivot for data modeling and DAX measures
Pivot Tables & Charts for visualization
This project helped me strengthen my skills in data cleaning, modeling, analysis, and dashboard design.
Feedback is always welcome