Dashboards to represent data analytics projects
تفاصيل العمل

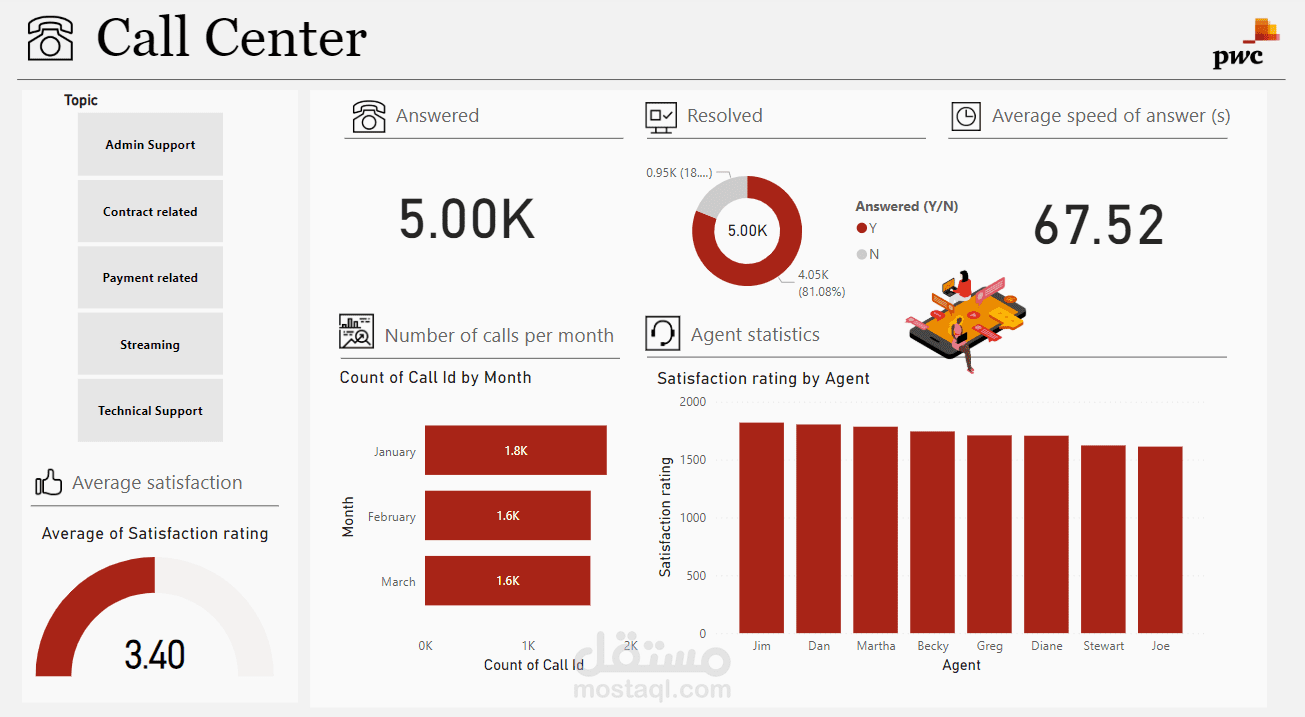
Project 1: Call Center Dashboard
This dashboard provides an overview of call center performance, including the total number of answered and resolved calls, average speed of answer, and customer satisfaction levels. It also highlights monthly call trends and agent performance to help evaluate efficiency and service quality. The dashboard is designed to support data-driven decision-making and performance improvement.
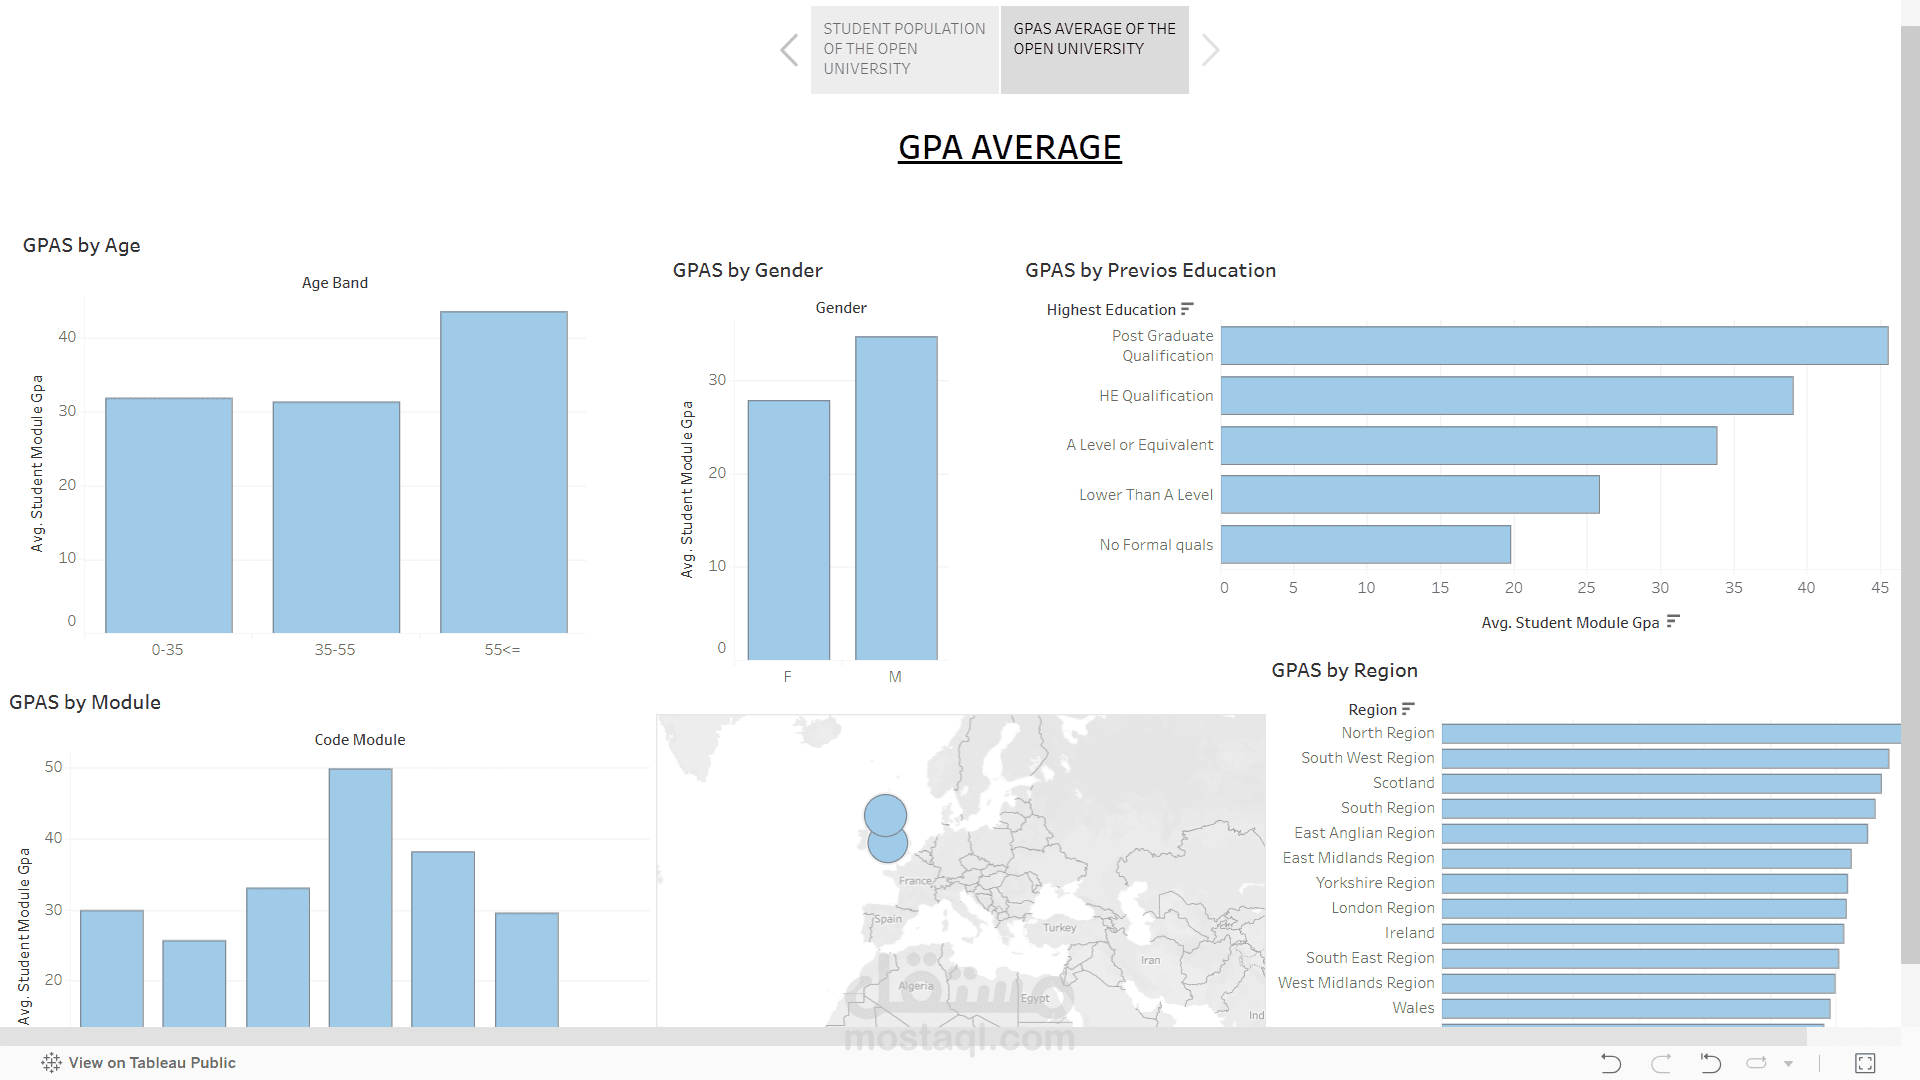
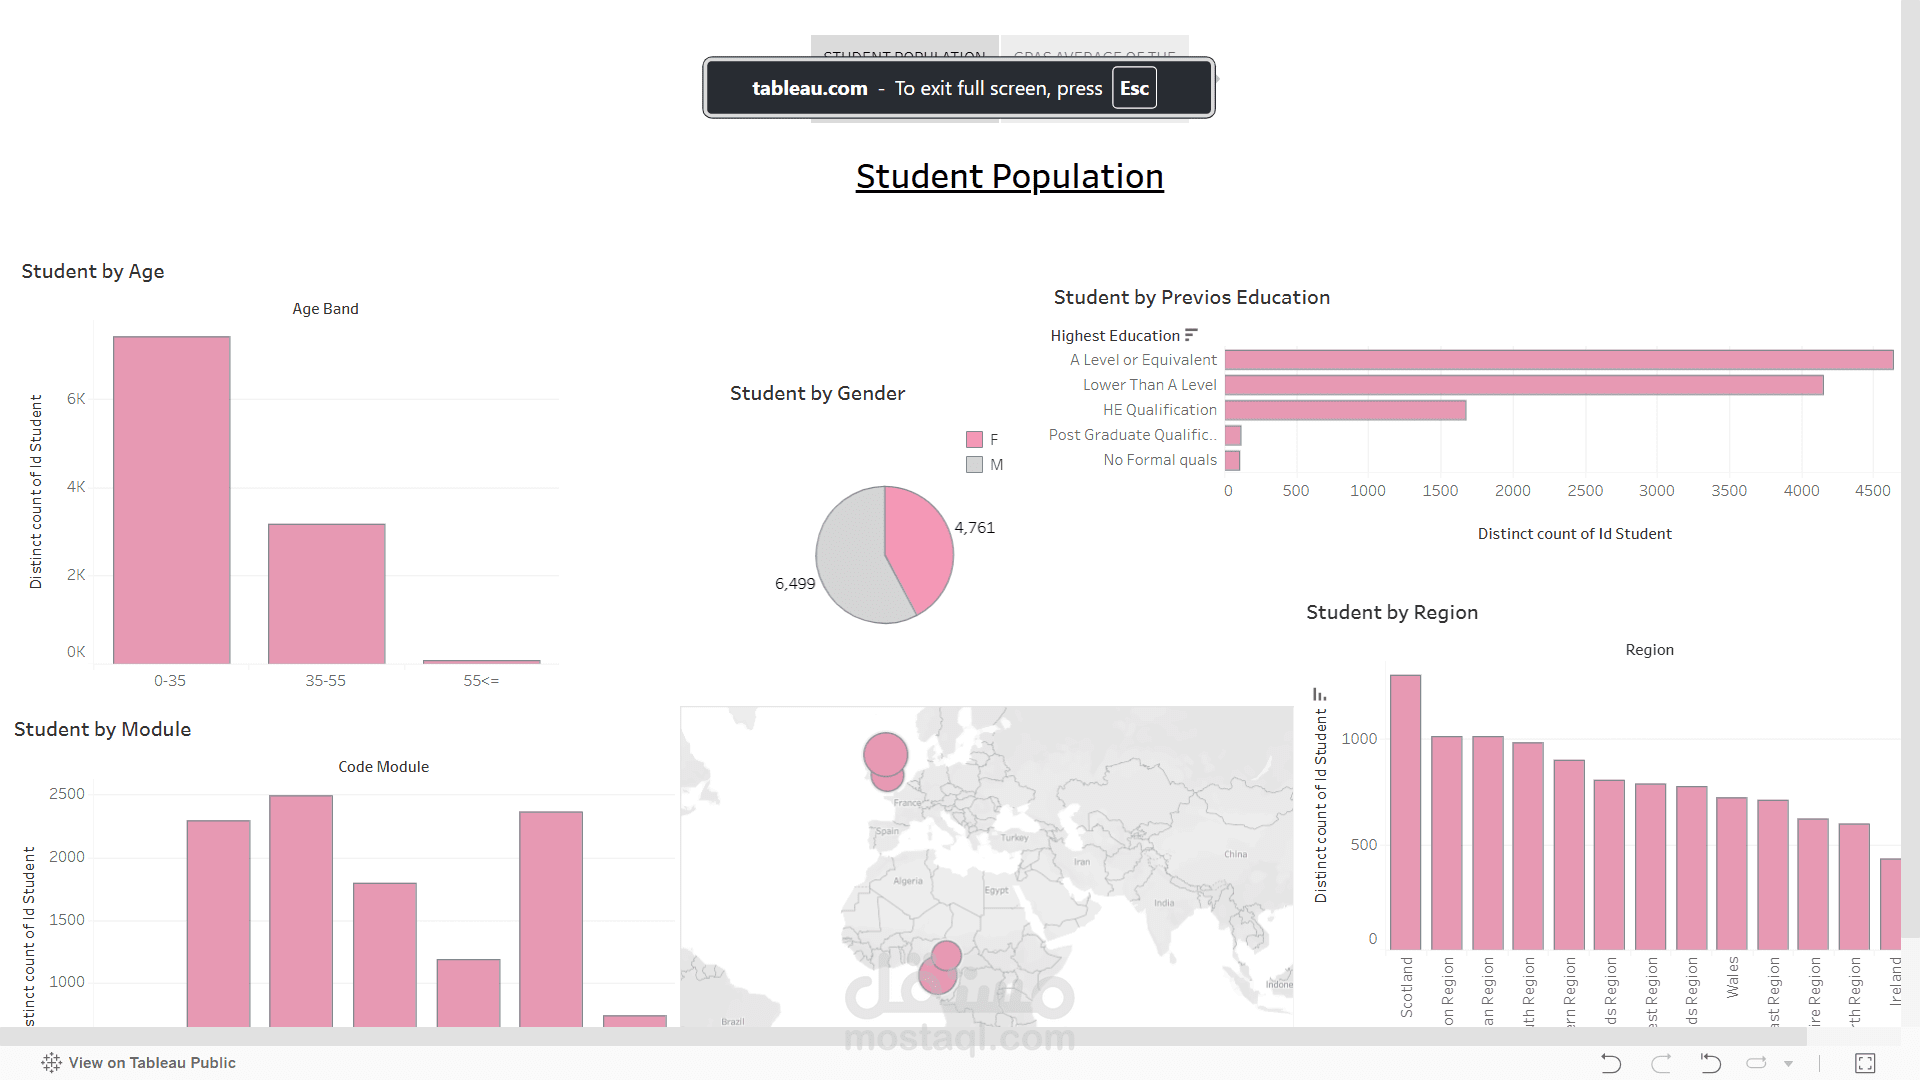
Project 2: Student Population Dashboard
This dashboard analyzes student population data based on age, gender, region, previous education, and enrolled modules. It presents insights through clear visualizations to better understand student demographics and distribution. The dashboard helps identify trends and patterns that can support academic planning and strategic decisions.