Monthly Expenses Analysis using Google Sheets
تفاصيل العمل

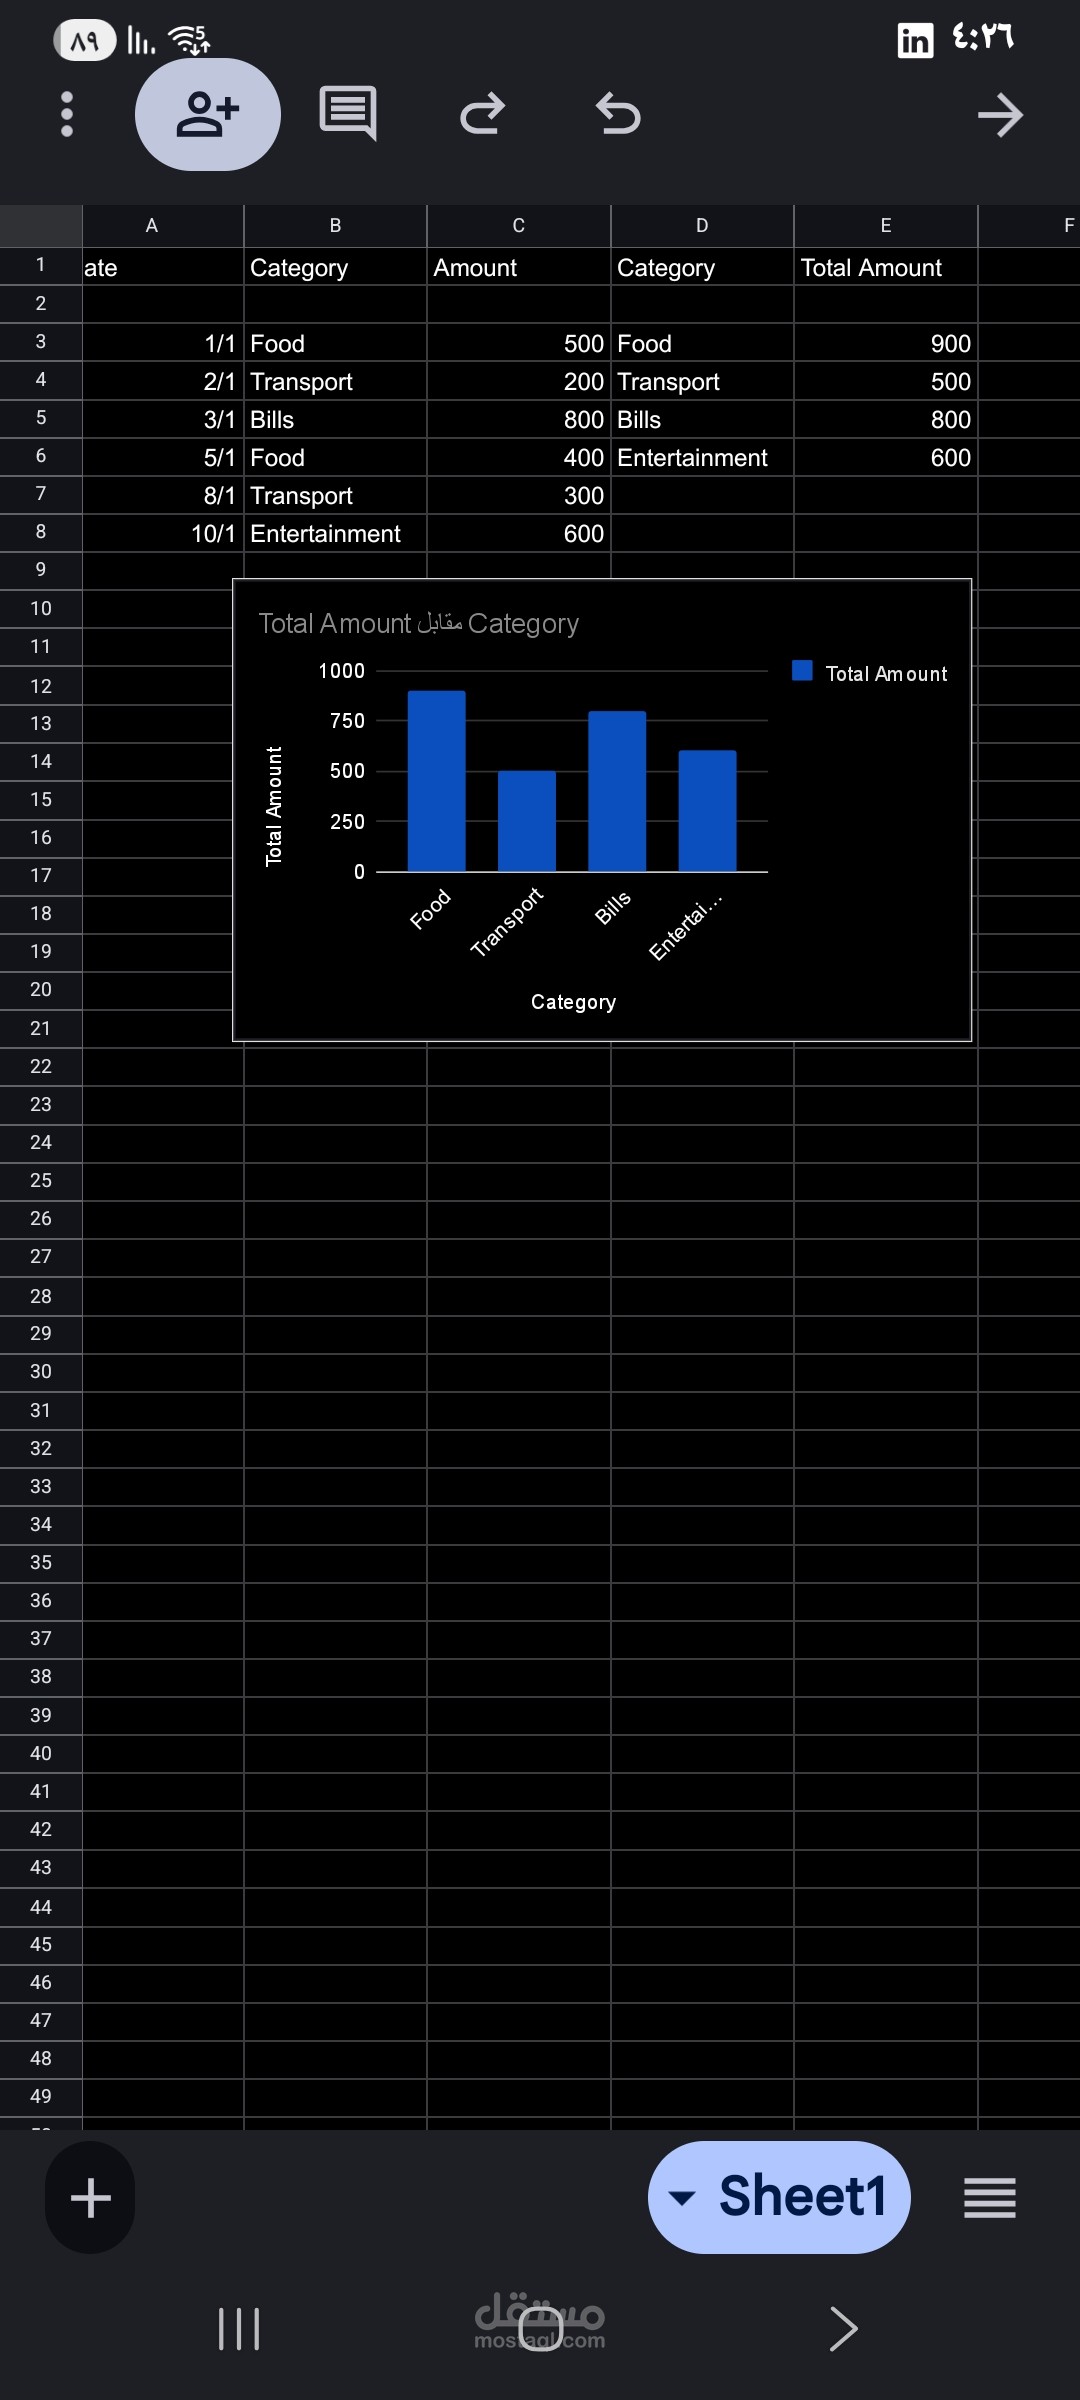
In this project, I analyzed monthly expense data using Google Sheets.
The data was organized by date, category, and amount.
I created a summary table to calculate total expenses for each category and designed visual charts to make the data easy to understand.
Tools Used:
- Google Sheets
Key Results:
- Clear breakdown of expenses by category
- Easy-to-read summary table
- Visual charts to support decision-making
This project helps individuals or businesses track spending and better manage monthly budgets.