HR Dashboard
تفاصيل العمل
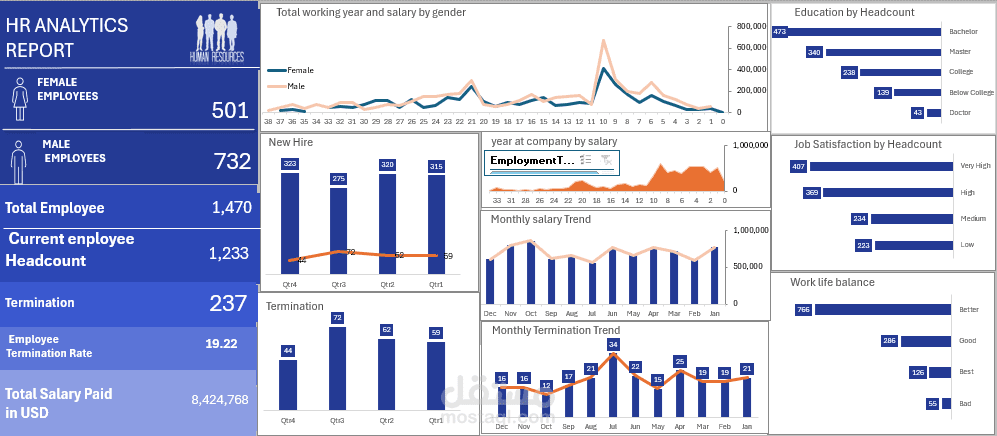
HR Analytics Dashboard Description
This HR Analytics Dashboard provides a comprehensive overview of workforce performance, employee demographics, and organizational HR trends. It enables HR teams to monitor key metrics related to hiring, salary trends, employee satisfaction, and terminations for data-driven decision making.
1. Workforce Overview
The left panel summarizes key HR metrics:
Female Employees: 501
Male Employees: 732
Total Employees: 1,470
Current Employee Headcount: 1,233
Terminations: 237
Termination Rate: 19.22%
Total Salary Paid: 8.4M USD
This section gives a quick snapshot of the workforce size, gender distribution, and payroll structure.
2. Working Years & Salary by Gender
The top chart shows the relationship between total working years and salary for male and female employees.
It highlights salary progression and possible differences in experience between genders.
3. New Hire Trend
The quarterly hiring chart displays the number of new employees recruited each quarter.
It shows fluctuations across Q1–Q4, helping identify recruitment cycles and hiring intensity.
4. Year at Company by Salary
This mini-chart presents how employee salary correlates with years spent in the organization.
It helps identify salary growth patterns and retention-related compensation trends.
5. Monthly Salary Trend
This combined bar and line chart tracks monthly salary expenses and average salary trends across the year.
It highlights salary peaks, payroll stability, and financial planning needs.
6. Monthly Termination Trend
The chart shows the number of employee terminations each month.
It helps HR identify turnover spikes, seasonal patterns, or organizational issues that may require attention.
7. Education Level by Headcount
This bar chart categorizes employees by education level:
Bachelor (highest count)
Master
College
Below College
Doctorate (lowest count)
This aids in understanding workforce qualification distribution.
8. Job Satisfaction by Headcount
The job satisfaction chart displays four levels: Very High, High, Medium, and Low.
It helps HR evaluate employee morale and identify improvement areas.
9. Work-Life Balance
This section shows employee assessment of work-life balance across four levels (Better, Good, Best, Bad).
It highlights overall employee well-being and potential burnout risks.
Overall Insight
The dashboard provides HR leaders with actionable insights on recruitment, retention, salary trends, employee satisfaction, and demographic structure. It supports strategic workforce planning and helps improve HR policies through data-driven decisions.