Dashboard of sales analysis
تفاصيل العمل
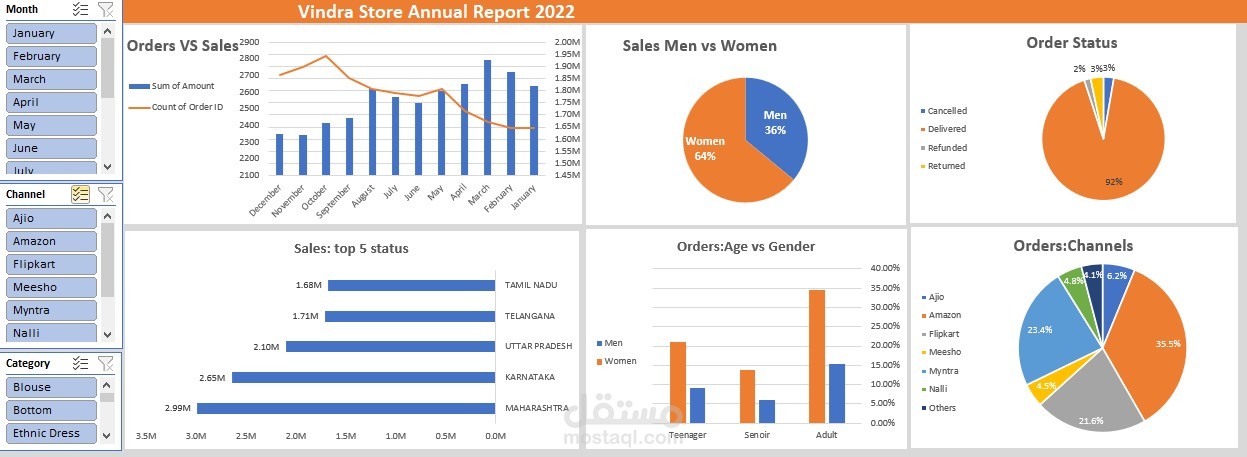
**Dashboard Description**
This dashboard presents the **Vindra Store Annual Report for 2022**, providing a comprehensive overview of sales performance, customer demographics, and order distribution across multiple dimensions.
### **1. Orders vs Sales Trend**
The top-left chart shows the monthly relationship between **total sales amount** and **number of orders**.
It highlights seasonal patterns, peaks in sales, and fluctuations in order volume throughout the year.
### **2. Sales by Gender**
A pie chart compares the contribution of men and women to overall sales.
* **Women:** 64%
* **Men:** 36%
This indicates that women contribute the majority of purchases for the store.
### **3. Order Status Breakdown**
This pie chart shows the proportion of orders by status:
* **Delivered:** 92%
* **Cancelled, Refunded, Returned:** Small percentages
This reflects strong operational efficiency and a high successful delivery rate.
### **4. Top 5 Performing States**
A horizontal bar chart highlights the top five states in terms of sales revenue, with **Maharashtra** and **Karnataka** being the highest contributors.
This insight helps identify key geographic markets.
### **5. Orders by Age and Gender**
This chart compares the distribution of orders among age groups (Teenager, Senior, Adult) split by gender.
The **Adult** age group shows the highest order activity, especially among women.
### **6. Orders by Channel**
The final pie chart displays the distribution of orders across different sales channels such as **Ajio, Amazon, Flipkart, Meesho, Myntra, Nalli, and Others**.
Channels like **Amazon, Flipkart, and Others** represent the largest share, indicating diversified customer touchpoints.
### **Filters (Slicers)**
The dashboard includes filters for:
* **Month**
* **Channel**
* **Category**
These allow users to interact with the report and analyze specific segments dynamically.