Comprehensive Electronics Store Performance Analysis
تفاصيل العمل

Comprehensive Electronics Store Performance Analysis
In this project, I analyzed sales and return data for an electronics store using Power BI with the goal of extracting deep insights that support data-driven decision-making. The analysis included a mix of order, customer, product, brand, shipping, and return data, presented through interactive dashboards.
? Project Overview
This project provides a complete analytical overview of an electronics store’s sales and returns performance.
The dashboard visualizes key metrics such as sales, profit, orders, customer behavior, product categories, and return reasons to identify growth opportunities and operational improvements.
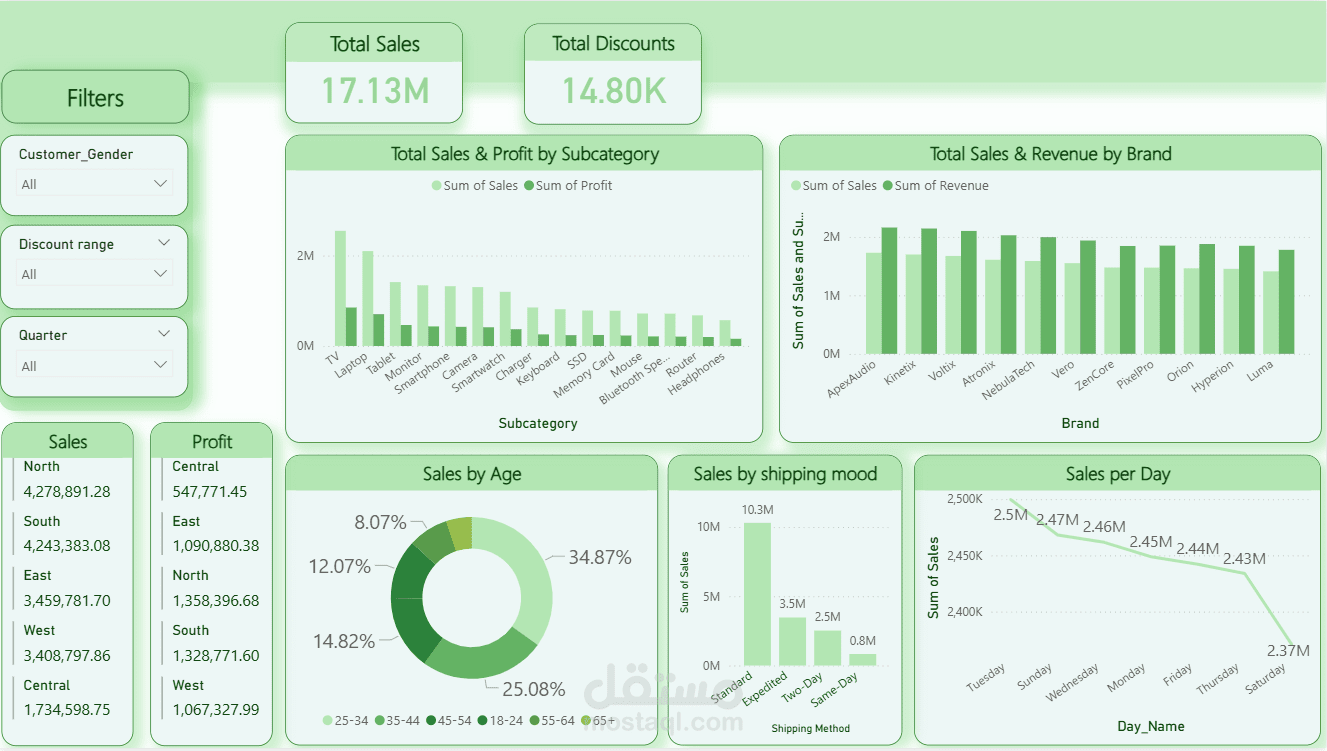
? 1. Financial Performance & Profitability
? Total Sales: $17.13M
Indicates strong demand and a large market size.
? Total Profit: $5.39M
A profit margin of 31.4%—excellent and reflects successful pricing and effective cost management.
? Discounts: $14.8K
Very low compared to sales volume, suggesting purchases rely on value rather than discounts.
Sales by Month
Sales remain stable at around $1.5M monthly.
Slight drop in November–December–February → opportunity to enhance seasonal promotions.
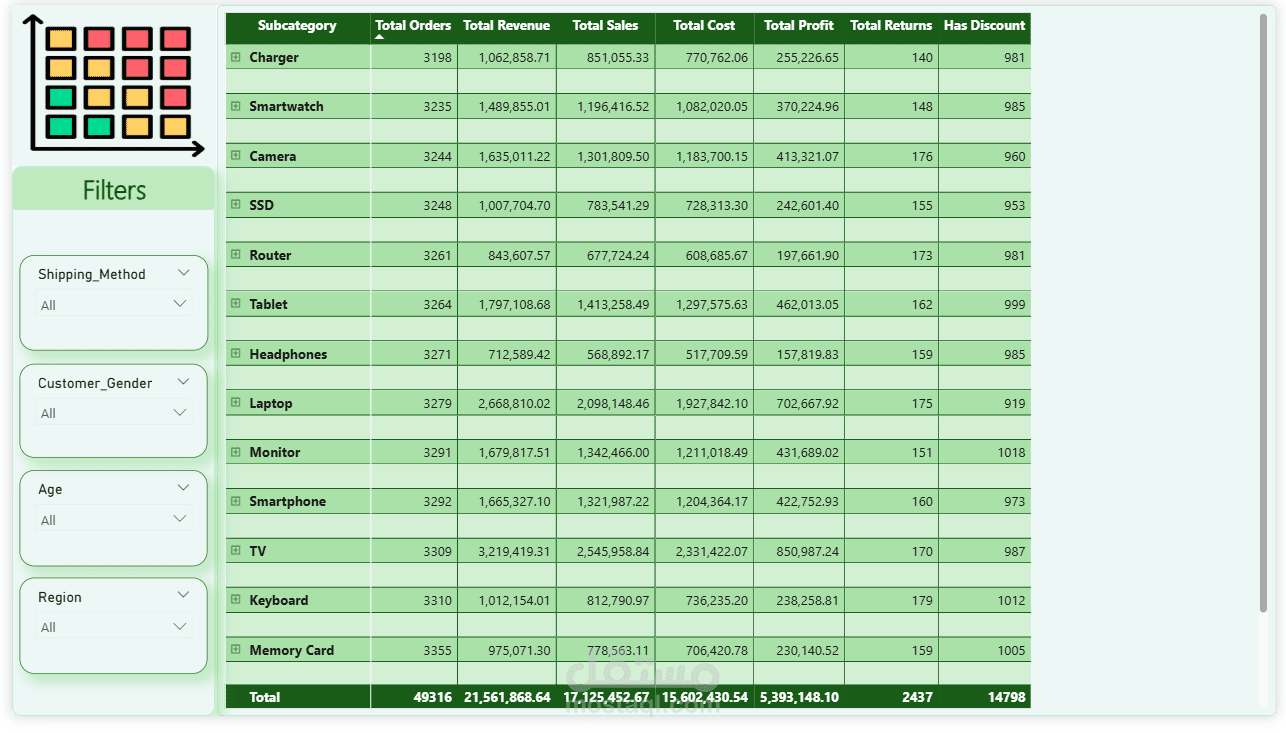
? 2. Product & Brand Analysis
Top-Performing Categories
TV and Laptop are the main drivers of both sales and profitability.
Recommendation: Ensure strong inventory levels + targeted advertising campaigns.
Opportunity Subcategories
Monitor, Smartphone, Camera
Performance can be improved through optimized pricing and promotional offers.
Brand Performance
Top Sales Brands:
ApexAudio – $1.73M
Kinetix – $1.70M
VoltiX – $1.67M
Highest Returned Brands:
Kinetix – 241
VoltiX – 238
Hyperion – 235
? Insight:
Kinetix and VoltiX lead both sales and returns → quality improvement and better after-sales support are needed.
? 3. Geographical & Operational Analysis
Regional Performance
Highest Sales:
North – $4.27M
South – $4.24M
Highest Profitability:
East – $1.09M + highest profit efficiency
Lowest Performance:
Central → lower sales and profit despite strong order volume
Insight:
The East region has an efficient operating model that could be replicated to improve Central’s performance.
Shipping Performance
Standard Shipping accounts for over $10M in sales.
However, it also contributes to the highest number of returns → 1466 returns.
➡️ Recommendation: Improve packaging quality and handling for economy shipping services.
? 4. Customer Demographics & Behavior
Most Valuable Customer Segments
Age 35–44: 34.87% of sales
Age 45–54: 25.08%
⬅️ Marketing efforts should be primarily targeted at these age groups.
Gender Distribution
Female: 48.13%
Male: 47.82%
Nearly equal → broad, inclusive marketing strategies are appropriate.
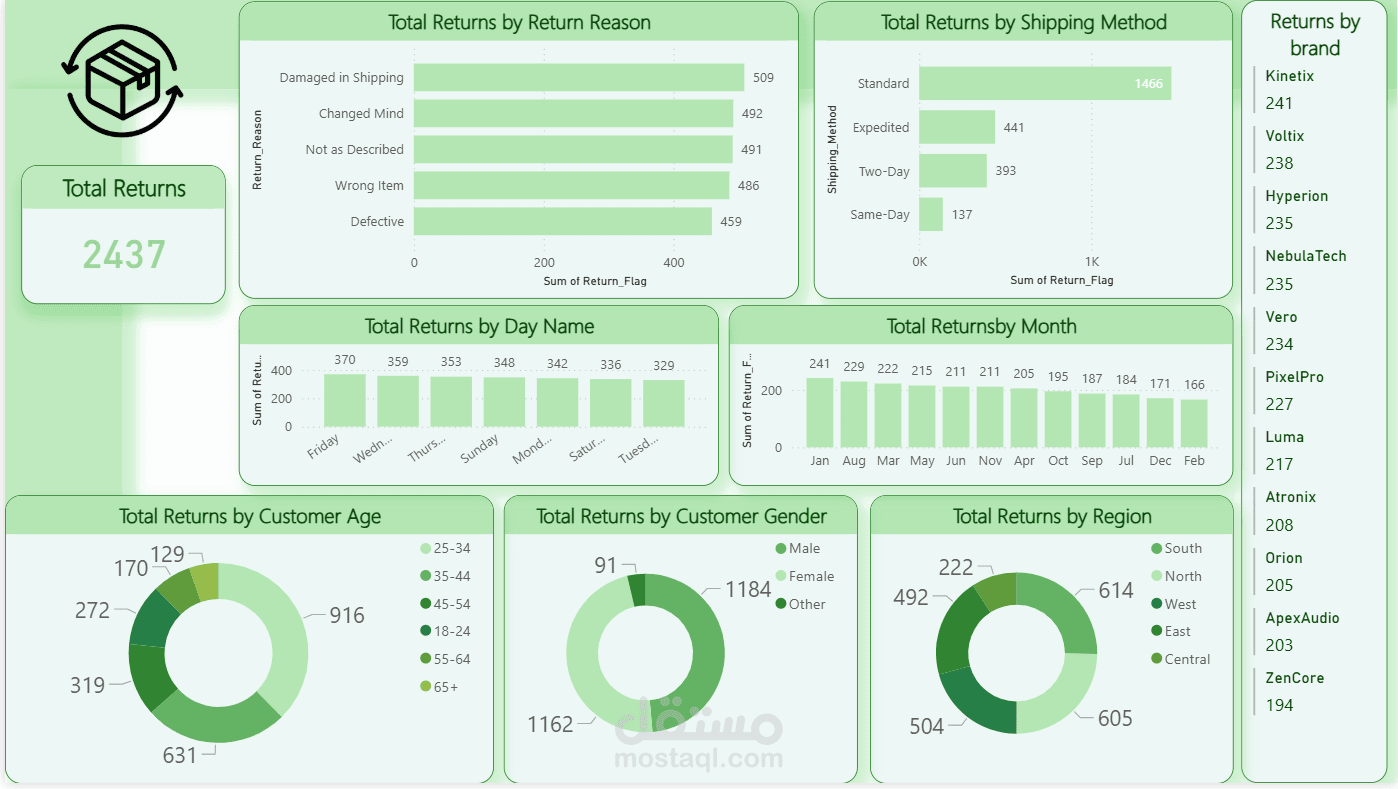
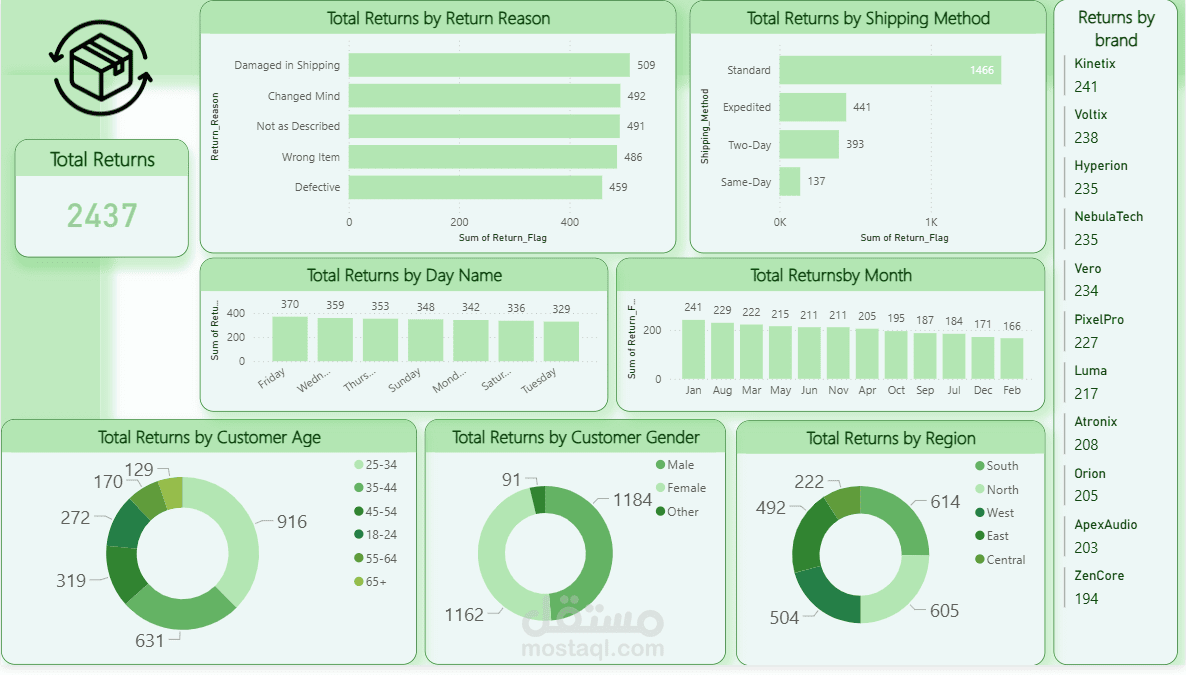
? 5. Returns Analysis
Total Returns: 2437
Top Return Reasons:
Damaged in Shipping (509) → indicates packaging/shipping weakness
Changed Mind (492) → flexible return policy or unclear expectations
Not as Described (491) → product descriptions and photos need improvement
By Shipping Method:
Standard Shipping accounts for the majority of returns → partly due to volume, but also highlights operational issues.
By Day of the Week:
Thursday and Friday show the highest return counts → likely linked to increased order volume before weekends.
✅ 6. Key Strategic Recommendations
? Improve Quality & Operations
Enhance packaging to reduce shipping damage.
Improve product descriptions and photos to reduce “Not as Described” returns.
? Strengthen Shipping Efficiency
Review Standard Shipping performance.
Train shipping partners or diversify carriers.
?️ Boost Core Categories
Increase investment in TV & Laptop.
Strengthen marketing for Monitor & Smartphone.
? Regional Optimization
Study the East region’s model
Apply its operational strengths to improve Central.
? Smart Demographic Marketing
Target campaigns toward the 35–54 age group.
Keep marketing gender-neutral due to balanced distribution.
? Summary
This project delivers a deep analysis of an electronics store’s performance using Power BI—covering sales, profitability, demographics, shipping, and returns.
The insights highlight key strengths and weaknesses and provide practical recommendations to improve overall performance and increase profitability.