Soda Production Dashboard
تفاصيل العمل

تنويه هام: "هذه البيانات غير حقيقية هي فقط مجرد محاكاة لنظام وسيستم الشركة وليس لها اي صلة تماما ببيانات الشركة"
من خط الإنتاج لشاشة التحليل: إزاي بنصطاد أعطال المكن بالأرقام؟
الداشبورد دي بقى بتلمس حتة جوانا كلنا في هندسة الإنتاج والعمليات! دي شاشة معمولة عشان تراقب خط إنتاج بتاع عصاير ومشروبات غازية. المميز هنا إن الديزاين بتاعها "مبهج" شوية وعامل زي اللعب، بس الأرقام اللي فيها بتكشف بلاوي بتحصل على خط الإنتاج!
تعالوا نشوف خط الإنتاج ده بيقول إيه:
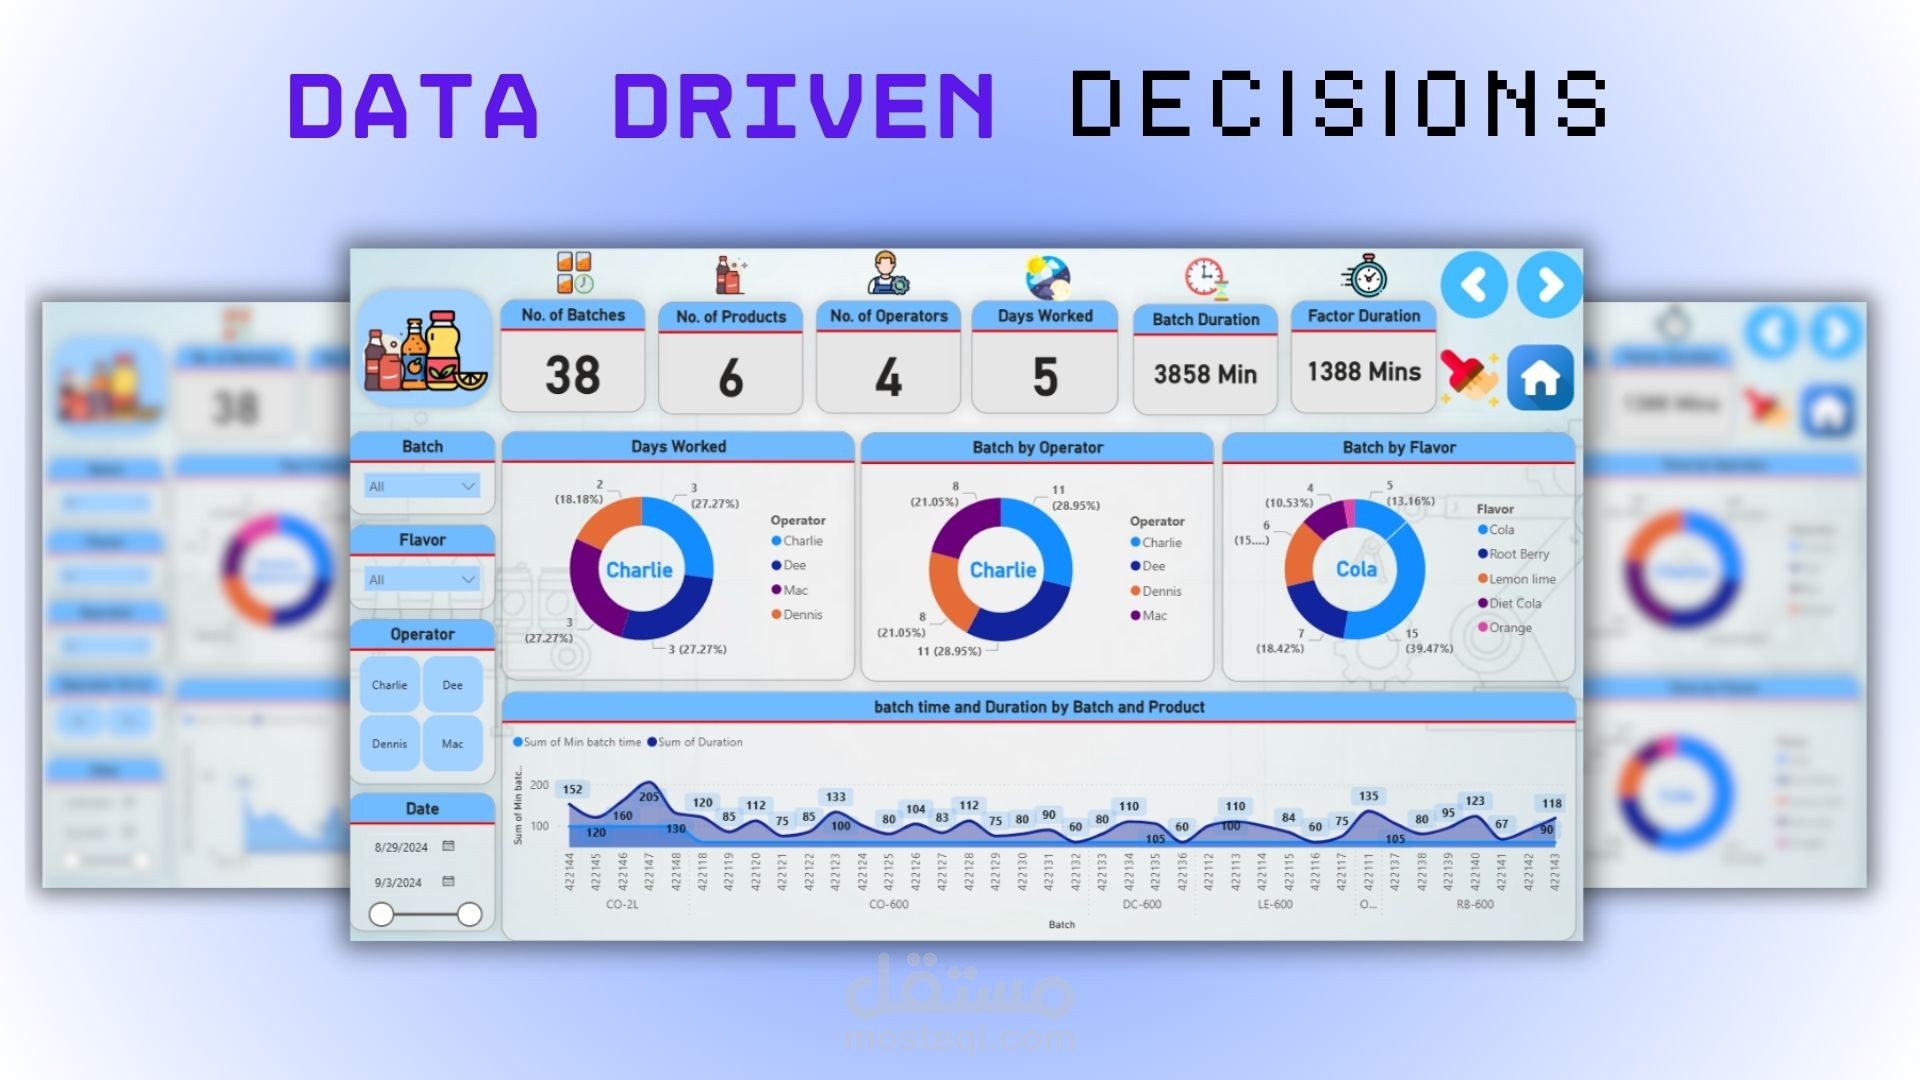
شفتية الشغل (الخلاصة): إحنا بنحلل شغل 5 أيام، اتعمل فيهم 38 "باتش" (أو تشغيلة)، لـ 6 منتجات مختلفة، واللي مشغل الخط كله هما 4 عمال (لو ركزت في أساميهم هتلاقيهم شلة مسلسل It's Always Sunny: تشارلي، دي، ماك، ودينيس ).
مين شايل الشغل؟: من الدوائر اللي في الشاشة الأولى، واضح جداً إن "تشارلي" و"دي" هما أكتر اتنين بيقفلوا تشغيلات، وتشارلي بالذات هو بطل خط الإنتاج.
المنتج الكسبان: الـ "كولا" (Cola) مكتسحة الإنتاج بحوالي 39%، وبعدها مشروب الـ (Root Berry).
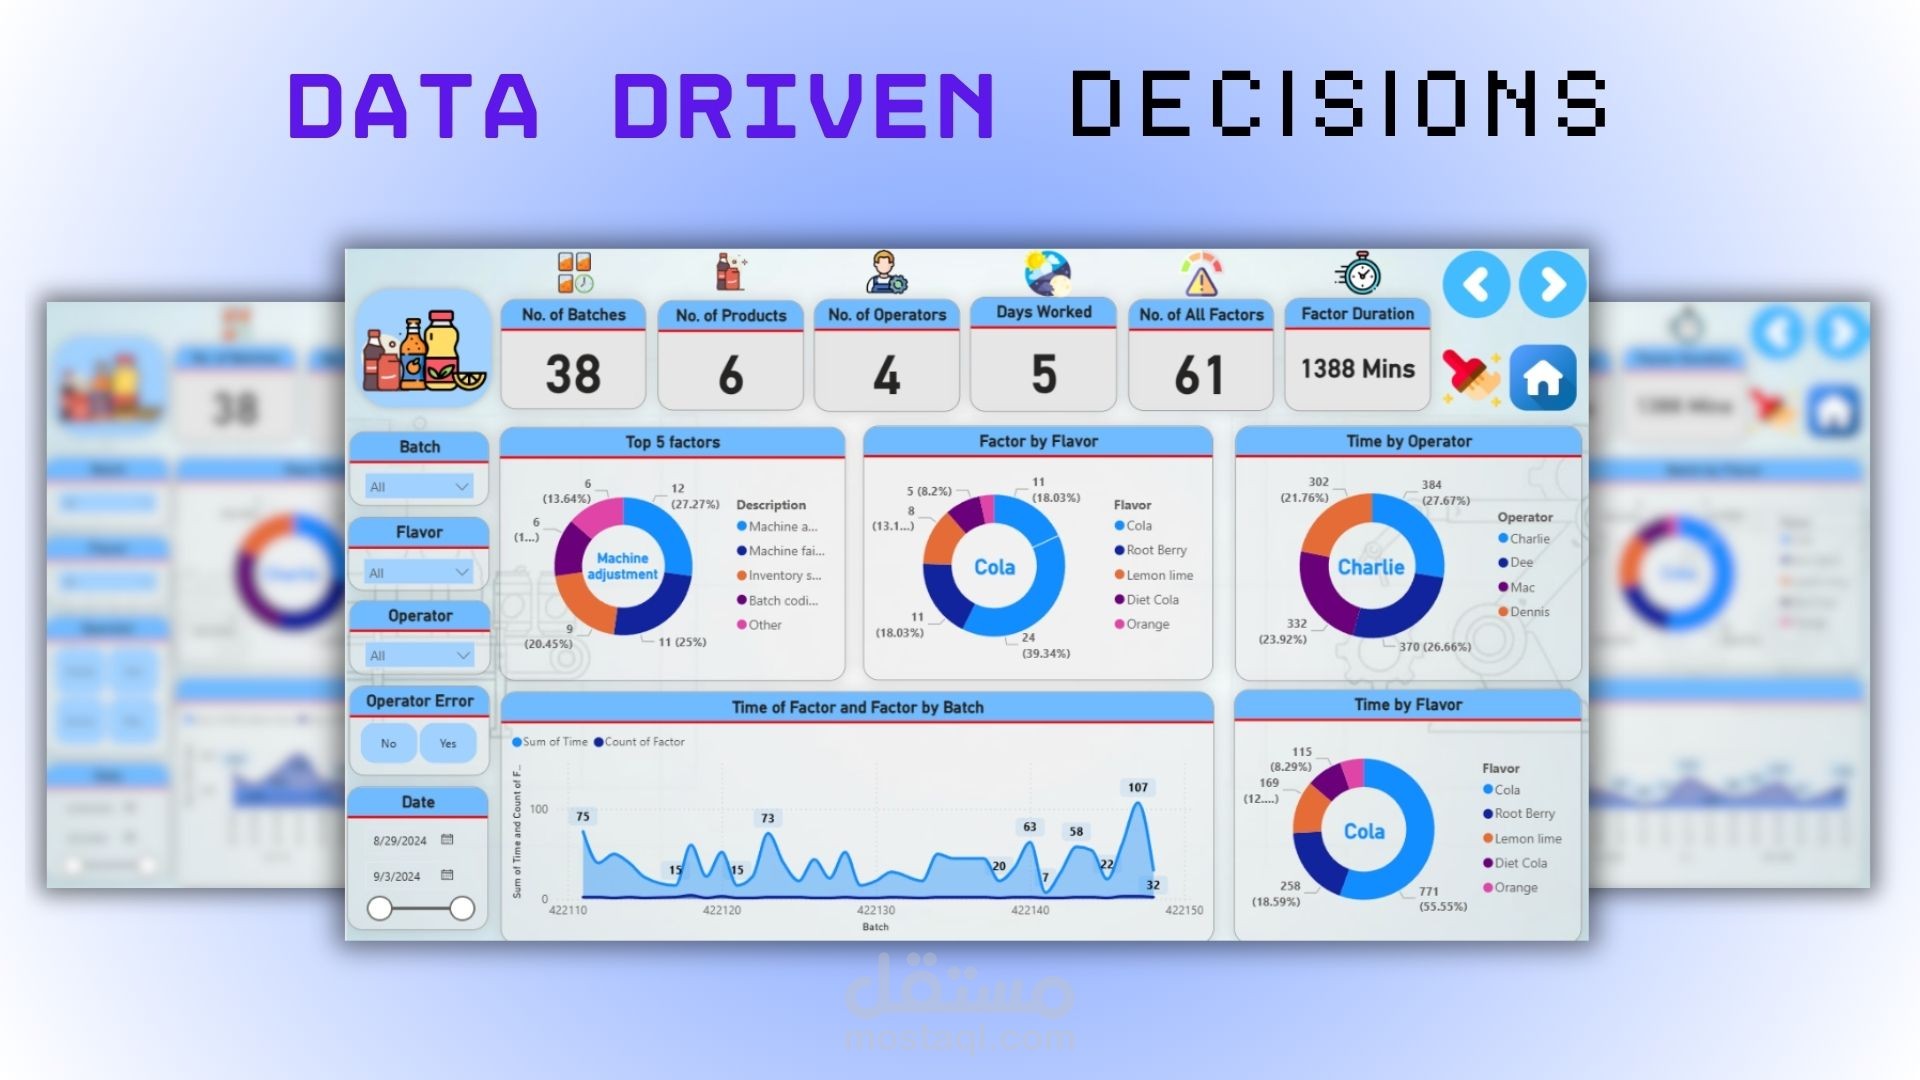
صيد الأعطال (لعبتنا بقى!): الشاشة التانية دي هي الكنز لأي مهندس عمليات. بتوريك الـ (Factors) أو أسباب وقوف الخط والمشاكل. أكبر كارثة بتضيع وقتهم هي "ضبط الماكينات" (Machine adjustment)، وبعدها إن المكن بيعطل أصلاً (Machine failure).
ربط الخيوط ببعض: لو بصيت على تحليل الوقت، هتلاقي إن "الكولا" زي ما هي أكتر منتج بيتصنع، هي برضه أكتر منتج بيعمل زحمة ومشاكل وبياخد وقت في تظبيط المكن (واخدة أكتر من 55% من وقت الأعطال!). ده جرس إنذار للإدارة إن خط الكولا محتاج صيانة شاملة أو إعادة معايرة عشان نقلل الهدر في الوقت.
Overview:
This dashboard is a process engineer’s dream, disguised in a very playful, gamified UI! It tracks the daily operations, batch times, and machine downtimes for a beverage manufacturing plant. It perfectly links human effort (operators) with machine efficiency.
Here is the story from the factory floor:
The Production Run: Over 5 working days, the plant successfully produced 38 batches across 6 different products, all managed by a lean crew of just 4 operators (fun fact: the names Charlie, Dee, Mac, and Dennis are a nod to the sitcom It's Always Sunny in Philadelphia!).
Operator Output: The donut charts in the first image show that "Charlie" and "Dee" are the heavy lifters on the floor, handling the majority of the batches.
The Star Product: "Cola" is the undisputed volume leader, making up nearly 40% of all batches produced.
Root Cause Analysis (The Bottlenecks): The second dashboard is where the real operational optimization happens. It tracks 61 different "Factors" (delays/issues) that cost the plant 1388 minutes of downtime. The #1 culprit? Machine Adjustments, closely followed by outright Machine Failures.
The Insight: While Cola is the most produced beverage, the charts reveal it is also the most problematic, accounting for over 55% of the total downtime! This tells the production management exactly where to focus their maintenance efforts—the Cola line needs calibration to reduce changeover and adjustment times.