Amazon Phones Performance Dashboard
تفاصيل العمل
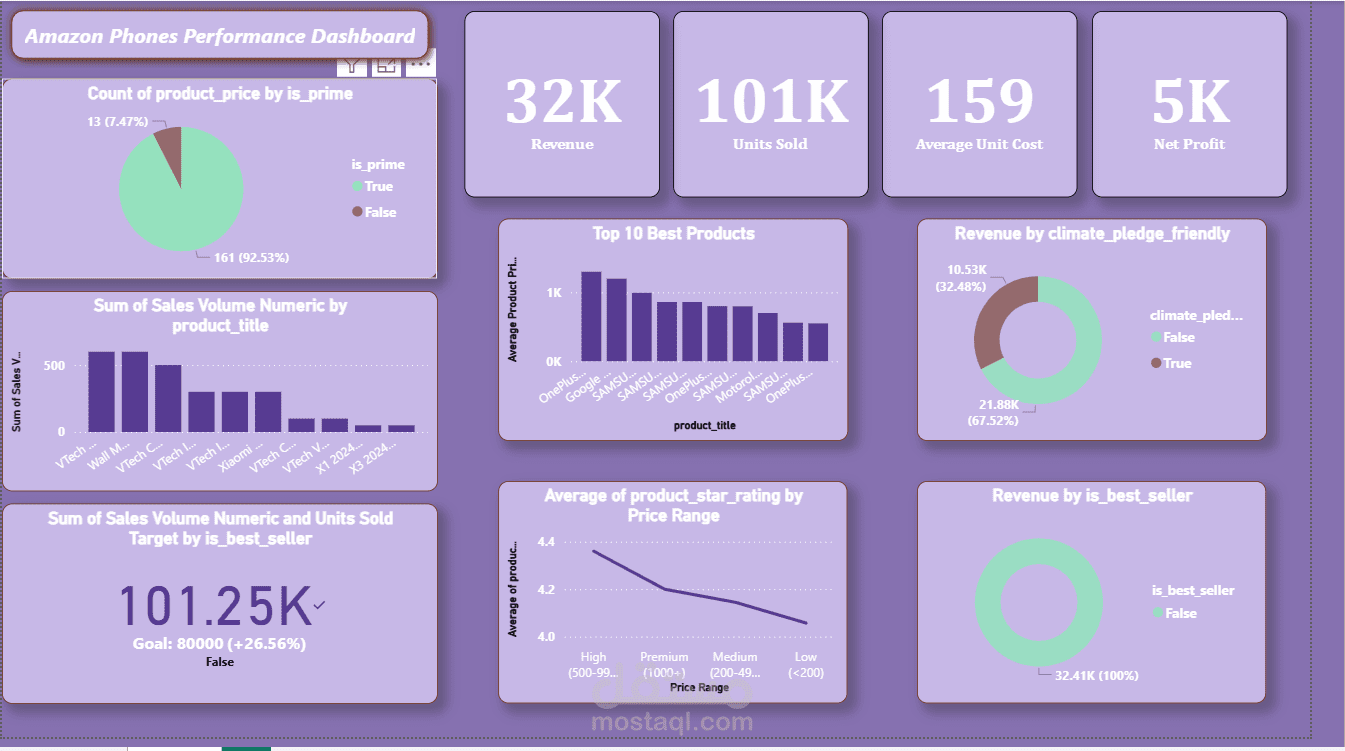
## Overview
This project presents an **interactive Power BI dashboard** analyzing Amazon phone sales.
It provides key insights into revenue, sales volume, profitability, and product performance, helping businesses make data-driven decisions.
## Features
- **KPIs**: Revenue, Units Sold, Average Unit Cost, Net Profit
- **Prime vs Non-Prime Products** analysis
- **Top 10 Best Products** ranking
- **Sales vs Target** tracking (+86.9% over target)
- **Revenue by Sustainability** (*Climate Pledge Friendly* products)
- **Customer Ratings** by price range
- **Best Seller Tag** revenue breakdown
## Dataset
The dataset contains Amazon phone product details such as:
- Product title
- Price and unit cost
- Sales volume
- Prime eligibility
- Star ratings
- Sustainability tag (Climate Pledge Friendly)
- Best seller status
## Visuals
- Pie charts (Prime vs Non-Prime, Climate Pledge Friendly, Best Seller)
- Bar charts (Sales by product, Top 10 products)
- Line chart (Ratings vs Price Range)
- KPI cards for quick performance tracking
## Tools Used
- **Power BI** for dashboard creation
- **DAX** for KPIs and calculations
- **Excel/CSV** as the data source