Car Sales Dashboard (Excel & Power BI Project)
تفاصيل العمل

تفضل النص كاملاً بالخط العادي (بدون زخرفة أو خطوط مائلة):
Car Sales Dashboard (Excel & Power BI Project)
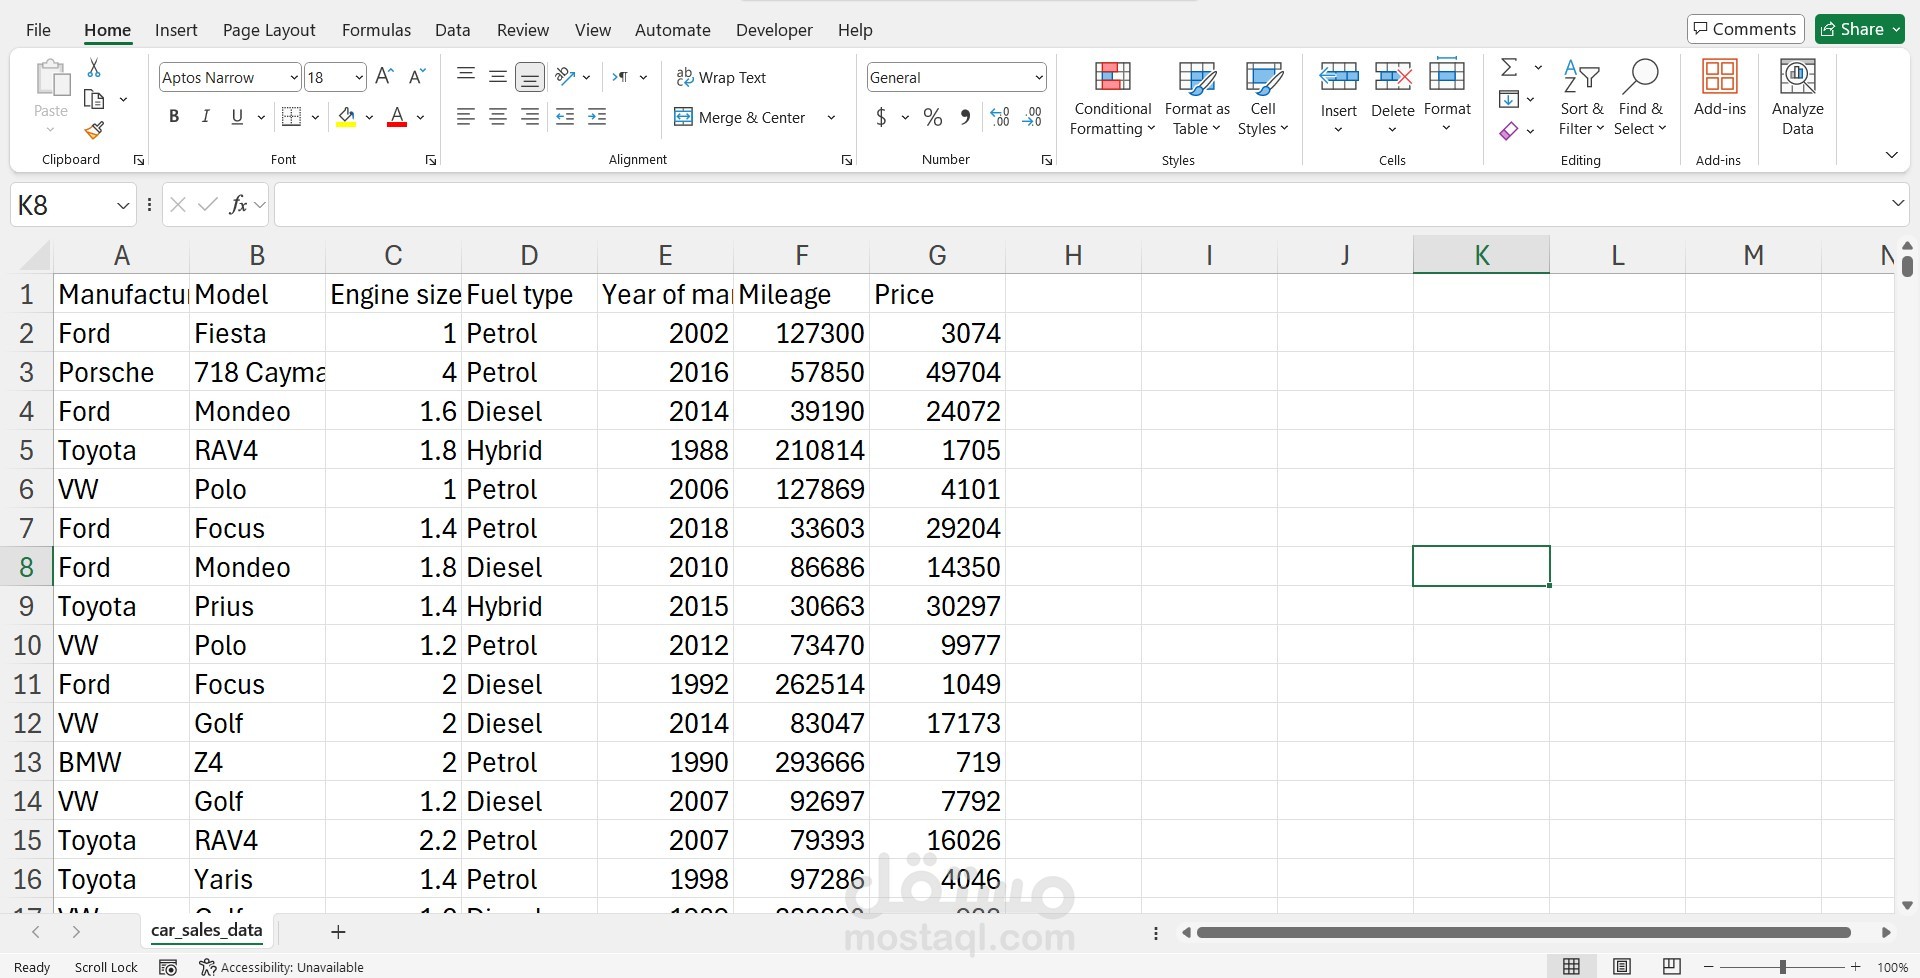
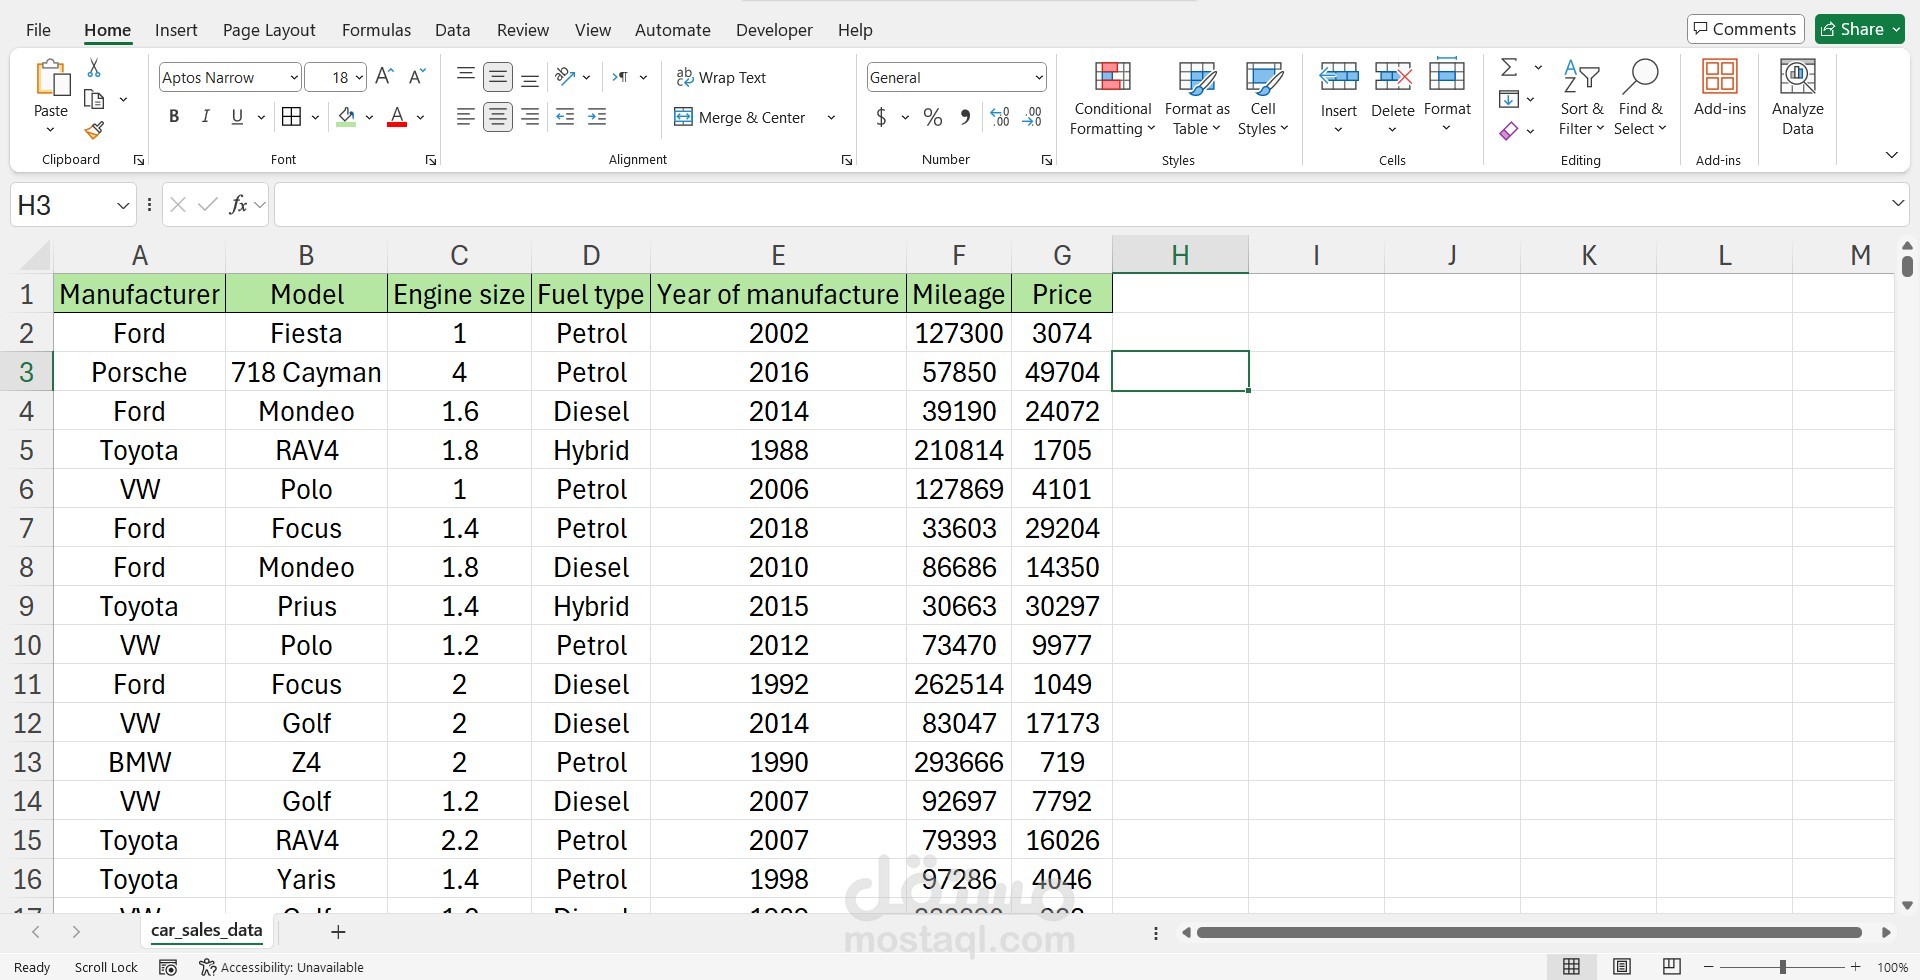
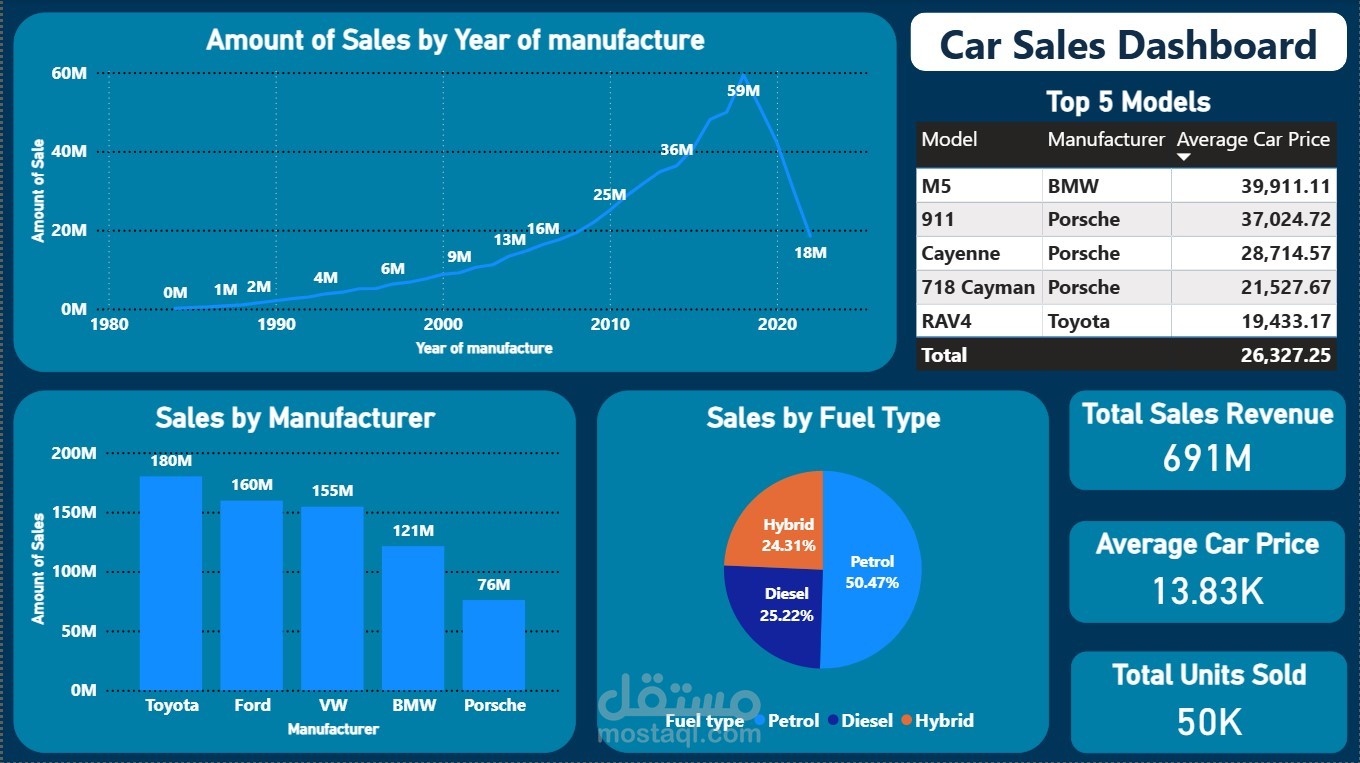
I developed an interactive dashboard to analyse 50,000 car sales records. The dataset includes information about manufacturers, models, fuel types, engine sizes, year of manufacture, mileage, and price.
Key Insights & KPIs:
Total Sales Revenue: 691M
Average Car Price: 13.8K
Total Units Sold: 50K
Top Manufacturers by Sales: Toyota, Ford, VW, BMW, Porsche
Top Models: BMW M5, Porsche 911, Porsche Cayenne, Porsche 718 Cayman, Toyota RAV4
Sales Distribution by Fuel Type: Petrol (50%), Diesel (25%), Hybrid (24%)
Sales Trend by Year of Manufacture showing market growth patterns.
Tools Used:
Excel for data cleaning & pre-processing.
Power BI for building interactive visualizations and KPIs.
This dashboard helps stakeholders quickly understand sales performance, customer preferences, and market trends to support data-driven decision-making.