clean data in excel using power query
تفاصيل العمل

Project Description: Sales Data Analysis using Power Query and Excel
Here is the description translated into English, structured for a project portfolio or report:
Project Overview
This project focuses on cleaning, transforming, and analysing an Online Retail sales dataset to enable the extraction of accurate business insights. Microsoft Excel and Power Query (also known as Get & Transform Data) were utilized as the primary tools to efficiently manage and process the data, ensuring its readiness for subsequent analysis and reporting.
Tools and Technologies Used
Microsoft Excel: Used as the base environment for data storage, final output presentation, and subsequent analytical tasks.
Power Query (Get & Transform Data): The central tool used to perform robust Extract, Transform, Load (ETL) operations.
Key Steps and Methodology
Data Extraction and Loading (Load):
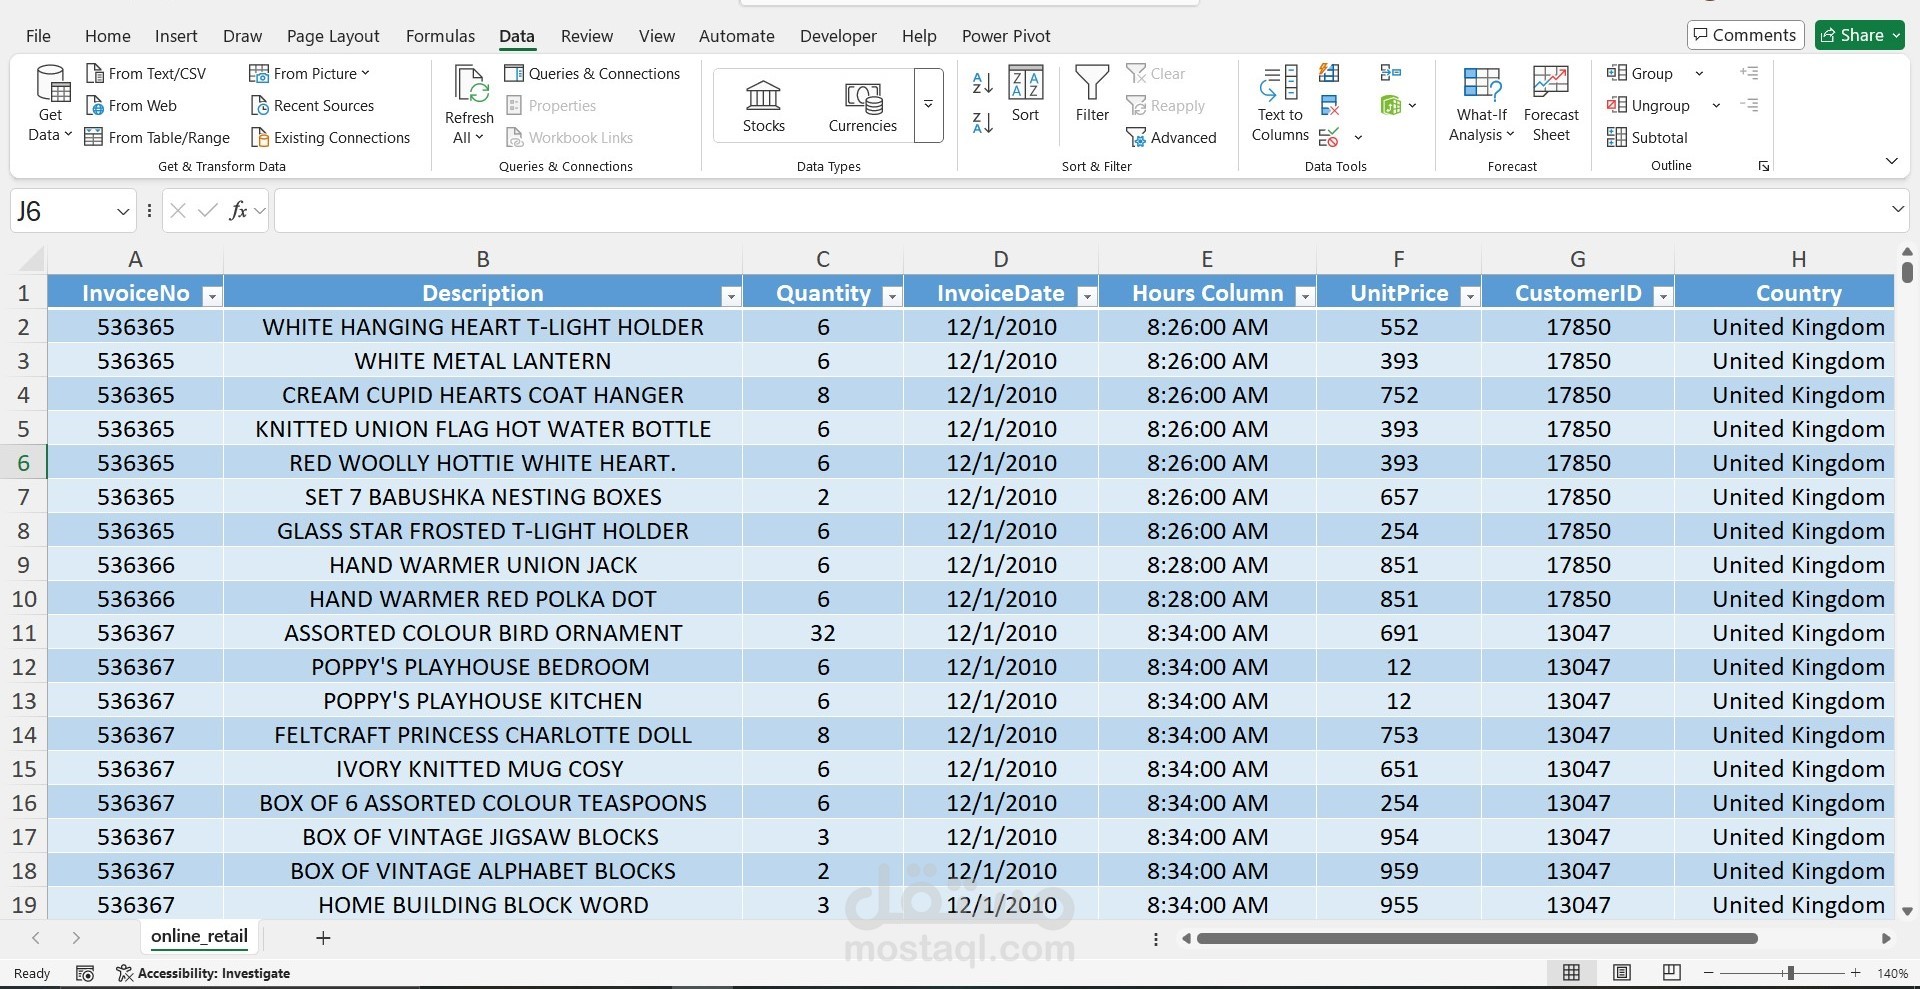
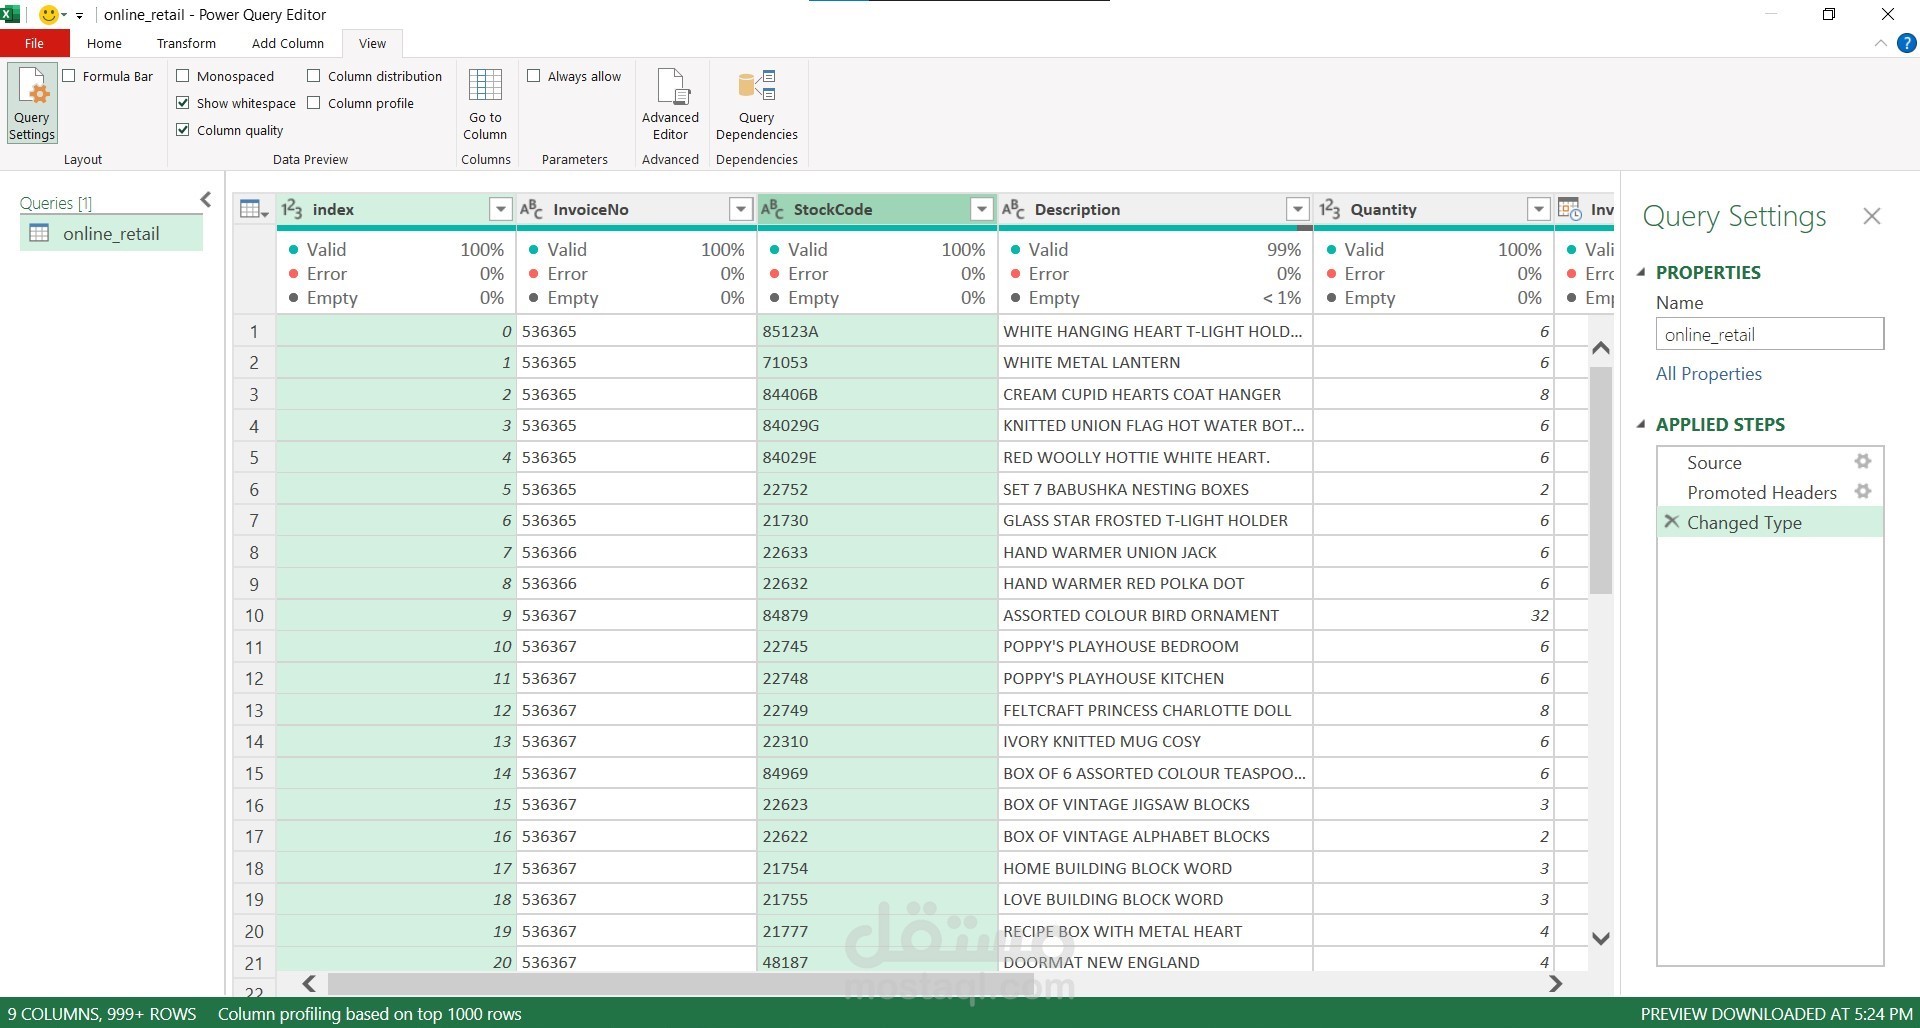
The raw data file was imported into the Power Query Editor.
Data Cleaning and Transformation (Transform):
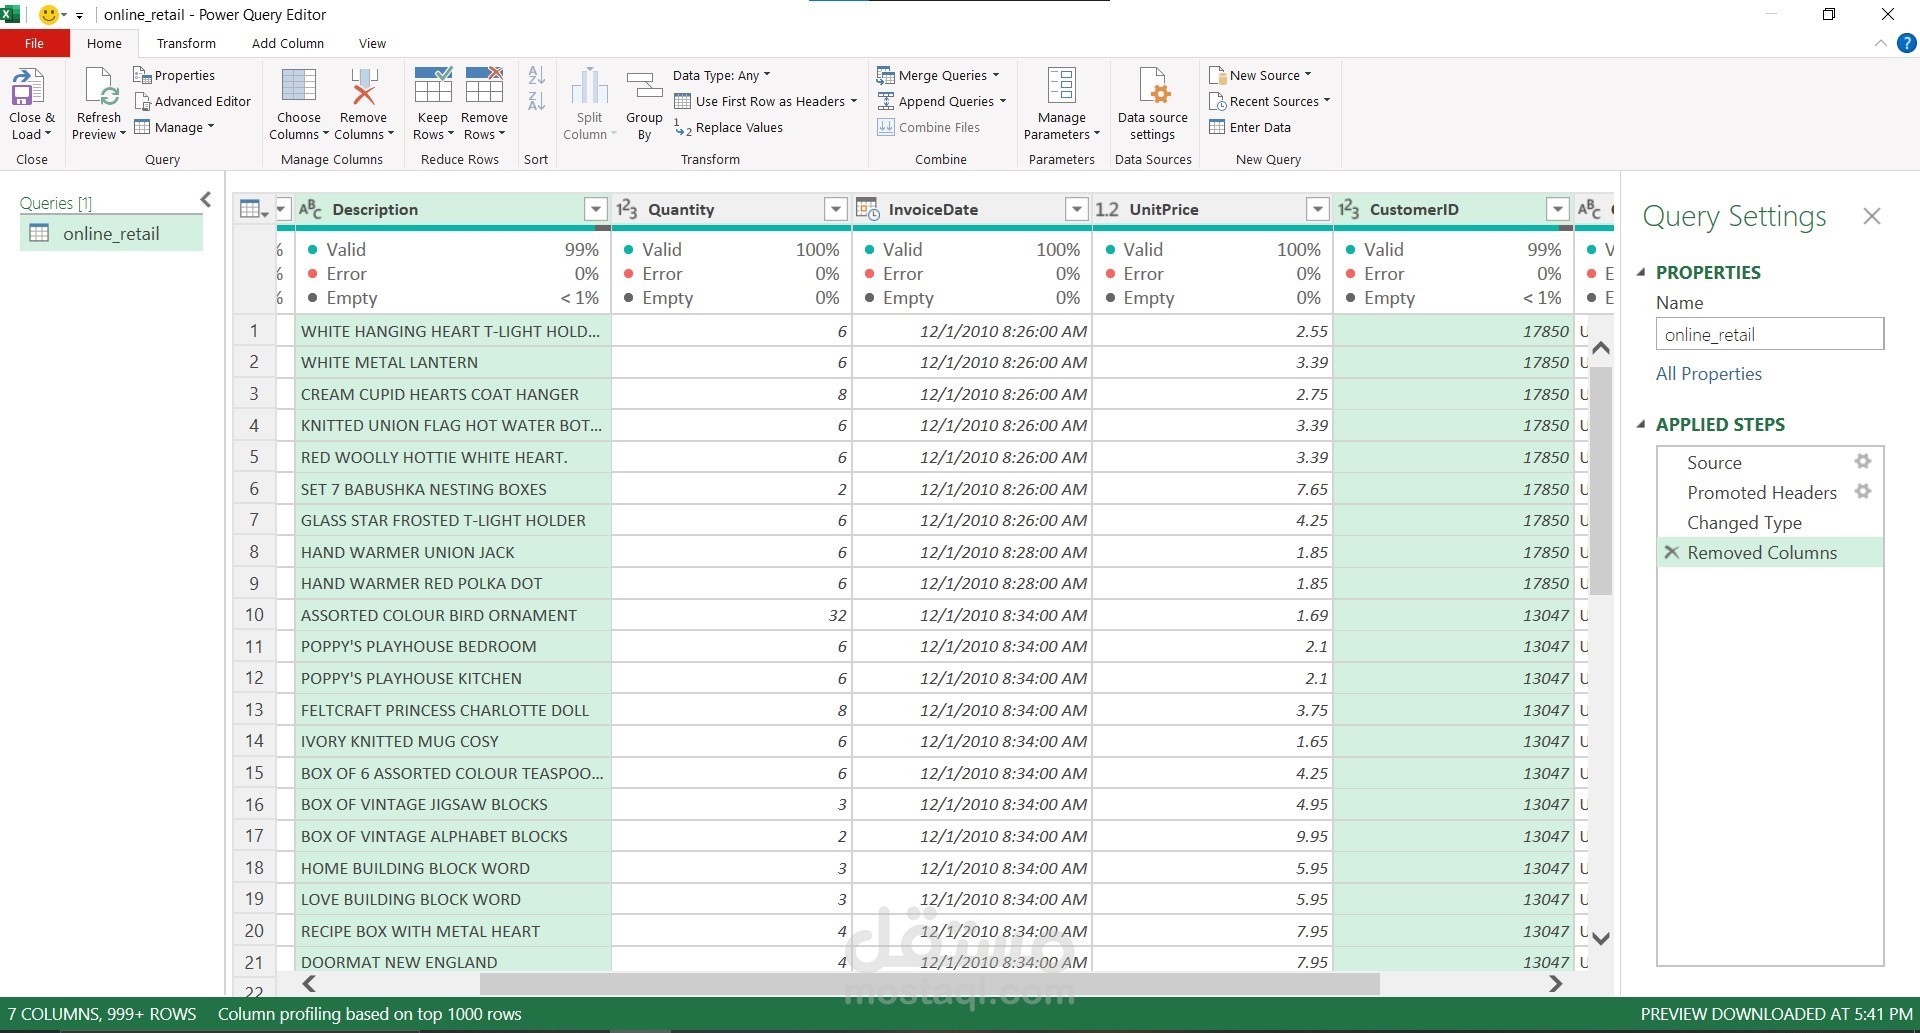
Column Management: Unnecessary columns (Index, Stock Code) that did not contribute to the final analysis were removed to simplify the dataset.
Error Correction: Columns were inspected for Errors and Null/Empty values, which were appropriately handled to ensure data integrity.
Data Type Conversion: Correct data types were assigned to each column, such as converting Invoice Date to a Date type and Unit Price to a Currency/Decimal Number type.
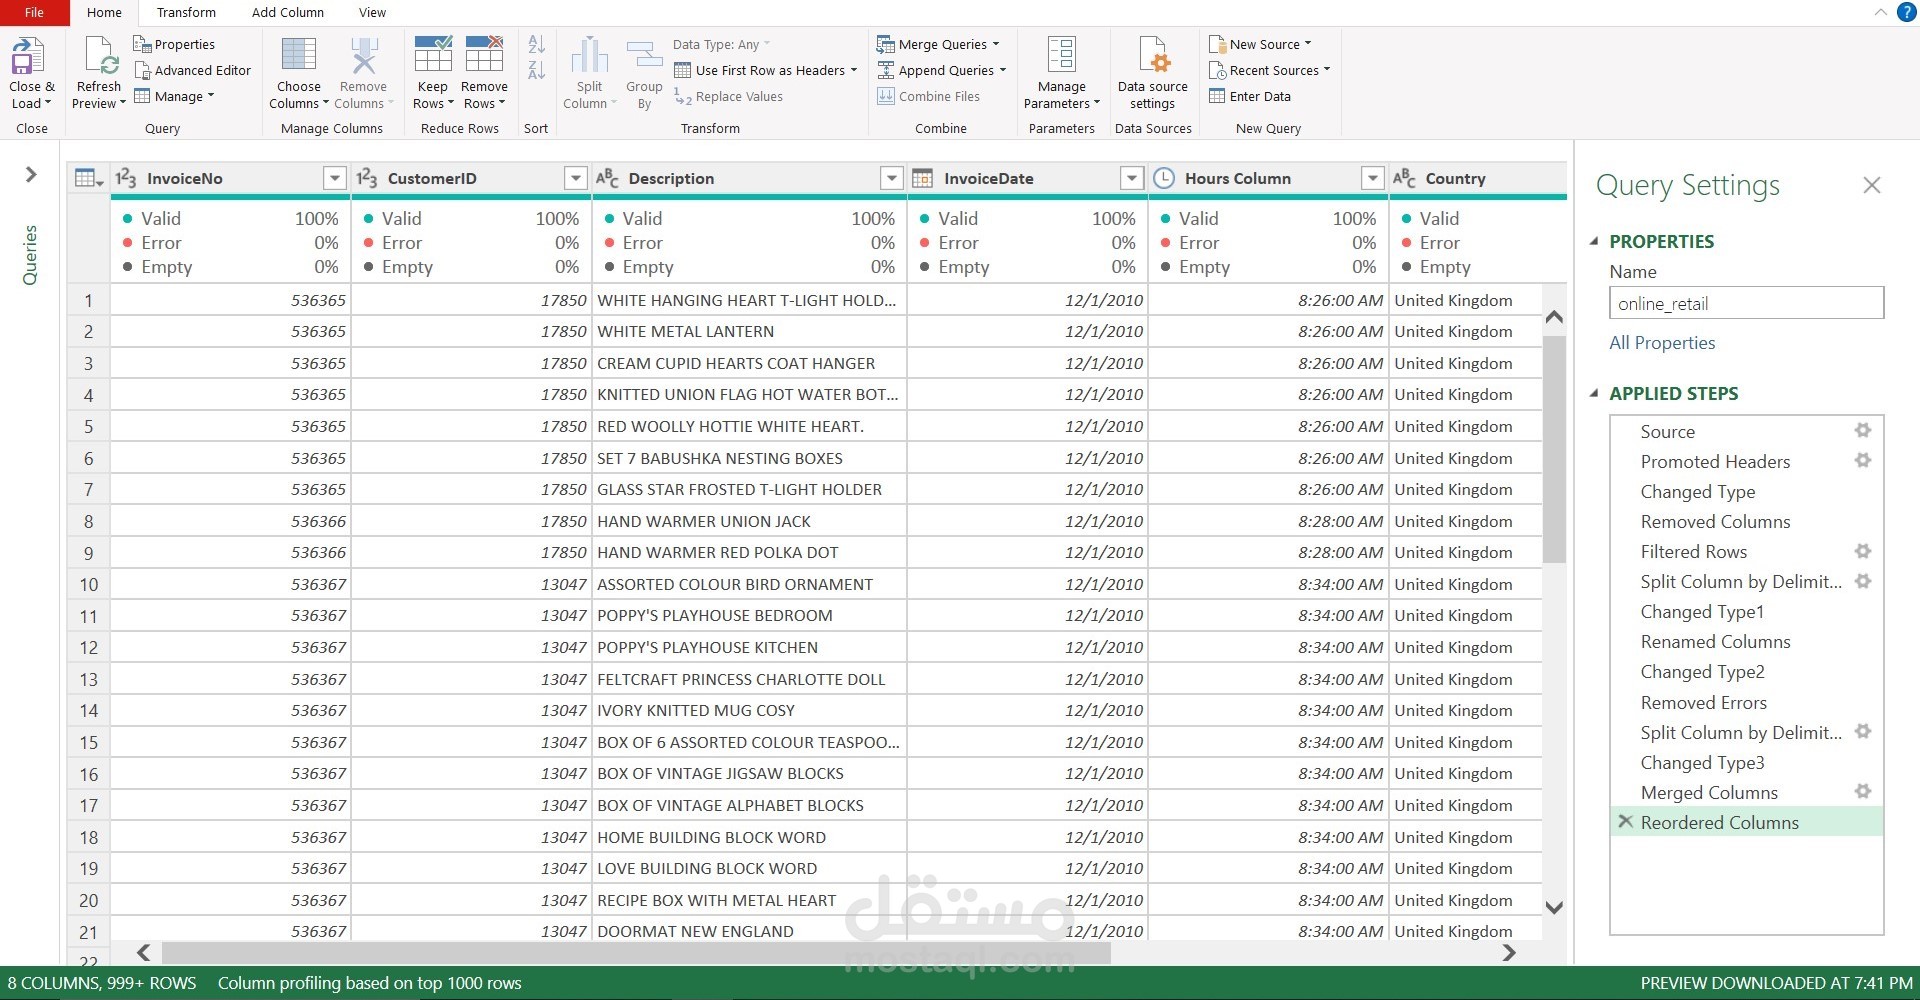
Feature Engineering (Creating New Columns): The Invoice Date column was split into two separate columns: Invoice Date (Date only) and Hours Column (Time only) to facilitate time-based analysis.
Data Integration and Formatting:
Column Reordering: Columns (such as moving Customer ID and Country to the front) were reordered to improve data readability and streamline subsequent operations.
Applying Steps: All transformation steps (Applied Steps) were systematically recorded in Power Query (e.g., Source, Promoted Headers, Changed Type, Removed Columns, Reordered Columns) to ensure the process is refreshable and reproducible.
Final Data Output:
The clean and transformed dataset was loaded from Power Query into an Excel worksheet, making it ready for creating Pivot Tables and necessary charts for analysis.
Project Value and Impact
Data Accuracy: Ensured high data quality by eliminating errors, handling missing values, and standardizing data types.
Operational Efficiency: Utilized Power Query to create a repeatable and automatically refreshable transformation process, saving time and effort compared to manual processing.
Analysis Readiness: The data was perfectly shaped and prepared to enable the extraction of insights related to sales performance, customer behaviour, and geographical distribution.