BMW Sales Dashboard (2010–2024)
تفاصيل العمل
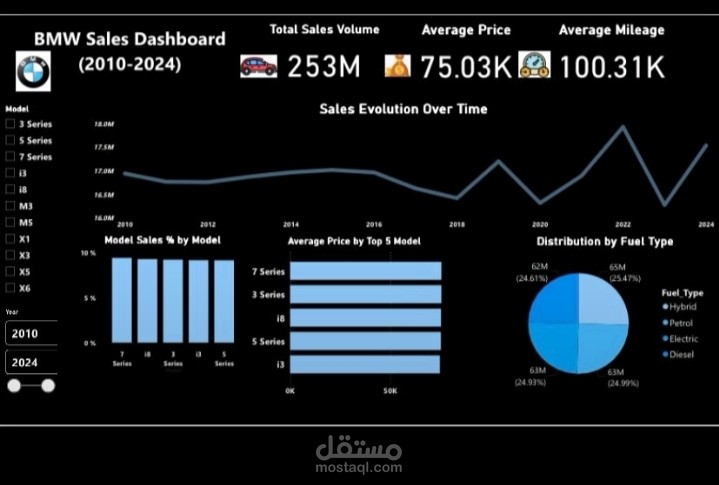
New Power BI Project: BMW Sales Dashboard (2010–2024)
I’m excited to share my latest Power BI project, where I analyzed BMW car sales data from 2010 to 2024 to uncover insights into model performance, pricing trends, and fuel type distribution.
Steps I Followed
1.Data Preparation:
•Imported the dataset into Power BI and cleaned it (checked data types, removed duplicates, and formatted numeric fields like Price and Sales Volume).
•Created calculated columns and DAX measures for total sales, average price, and average mileage.
2.Data Modeling:
•Organized the data model to ensure smooth relationships between key fields such as Model, Year, Fuel_Type, and Region.
•Added measures for KPIs like:
•Total Sales Volume = SUM(Sales_Volume)
•Average Price = AVERAGE(Price_USD)
•Average Mileage = AVERAGE(Mileage_KM)
Key Insights
•The 3 Series and 5 Series remain BMW’s top sellers.
•Sales of electric and hybrid models have grown significantly in recent years.
•Despite higher mileage, some luxury models maintain strong average prices.
? Tools Used
•Power BI Desktop
•DAX for calculated measures
•Data visualization
I really enjoyed building this dashboard — it helped me strengthen my skills in data visualization, business insights, and storytelling with Power BI.
#PowerBI #DataAnalytics #BMW #DataVisualization #BusinessIntelligence #DashboardDesign