Sales Dashboard
تفاصيل العمل
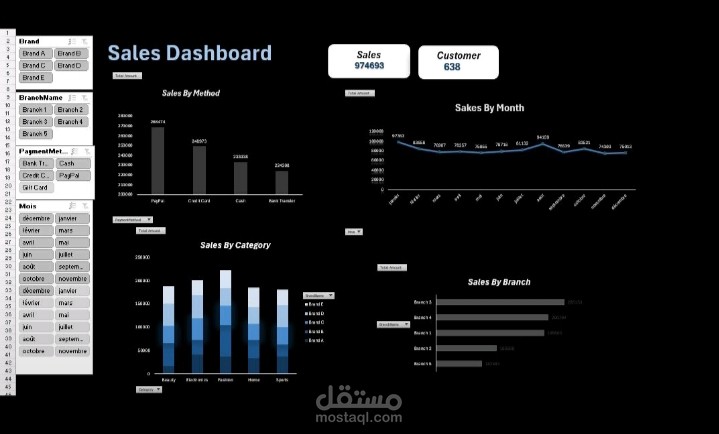
Creating an Interactive Sales Dashboard in Excel
I recently completed a Sales Dashboard fully built in Microsoft Excel, combining data analysis and interactive visualization.
? Key Project Steps:
1️⃣ Data Cleaning & Transformation with Power Query
Removed duplicates
Standardized formats
Filtered and prepared raw data
2️⃣ Data Modeling with Power Pivot
Created relationships between tables
Star schema linking sales, customers, products, and payment methods
3️⃣ Calculations & Measures with DAX
Total sales and customer counts
Sales by payment method, month, category, and branch
4️⃣ Visualization & Interactivity
PivotTables and dynamic charts
Slicers to filter by brand, branch, month, or payment method
Clear, intuitive, and interactive dashboard
Tools Used: Excel | Power Query | Power Pivot | DAX | PivotTables