FinTrust Analytics – Financial Performance Dashboard (Power BI)
تفاصيل العمل
Project Title:
FinTrust Analytics – Financial Performance Dashboard (Power BI)
Company Context:
FinTrust Analytics is a microfinance and investment company providing loans and small-scale investment services. The goal was to analyze client financial data to optimize lending decisions, improve profit margins, and identify high-value customers.
Objective:
To create a Power BI dashboard that provides a clear view of loan performance, customer behavior, and investment trends — enabling data-driven decisions for growth and risk management.
Dataset Overview:
The dataset contains financial and demographic details of clients:
Client ID, Gender, Region
Income, Credit Score, Loan Amount, Loan Status
Interest Rate, Investment Value, Loan Date.
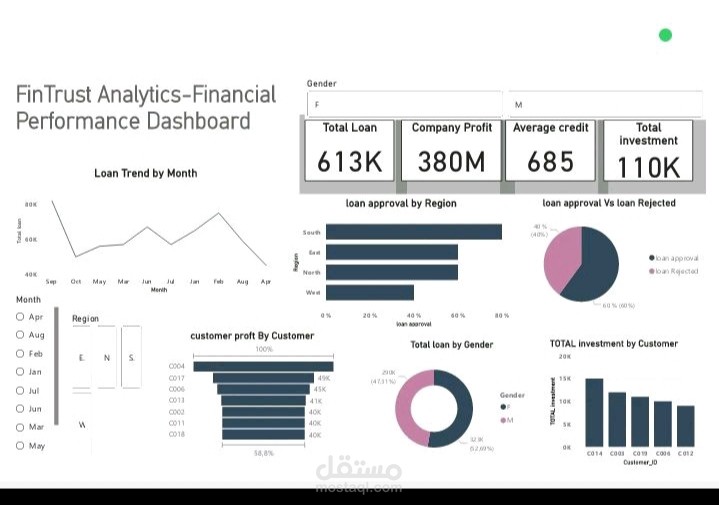
Dashboard Visuals:
1. KPI Cards – Total Loan, Total Investment, Average Credit, Company Profit.
2. Loan Trend by Month (Line Chart) – Seasonal lending pattern.
3. Loan Approval by Region (Bar Chart) – Regional performance comparison.
4. Loan Approval vs Rejected (Pie Chart) – Loan decision ratio.
5. Total Loan by Gender (Donut Chart) – Gender distribution analysis.
6. Top Profitable Customers (Bar Chart) – Identifying most valuable clients
7. Total Investment by Customer (Bar Chart) – Investment engagement analysis
Insights & Business Decisions:
1. Credit Policy Optimization:
Clients with credit scores below 600 have a 40% higher rejection rate → refine approval criteria to reduce risk.
2. Regional Focus:
Northern and Central regions show higher approval rates and profit margins → focus future marketing and loan products there.
3. Investment Cross-Selling:
25% of loan clients also invest → introduce combined loan-investment offers to increase revenue per customer.
4. Gender Balance:
Male clients represent 65% of total loans → design campaigns targeting female entrepreneurs.
5. Profit Strategy:
Highest profits come from clients with income above 1500 → create premium investment packages for this segment.
? Tools Used:
Microsoft Power BI
Data Cleaning in Power Query
DAX Formulas for KPIs
Data Visualization Design (Custom Theme, KPI Cards, Interactive Filters) lol
Final Result:
An interactive, executive-level Power BI dashboard that provides clear, actionable insights on loans, investments, and customer profiles — enabling FinTrust to enhance decision-making, profitability, and customer engagement.