analysis data
تفاصيل العمل
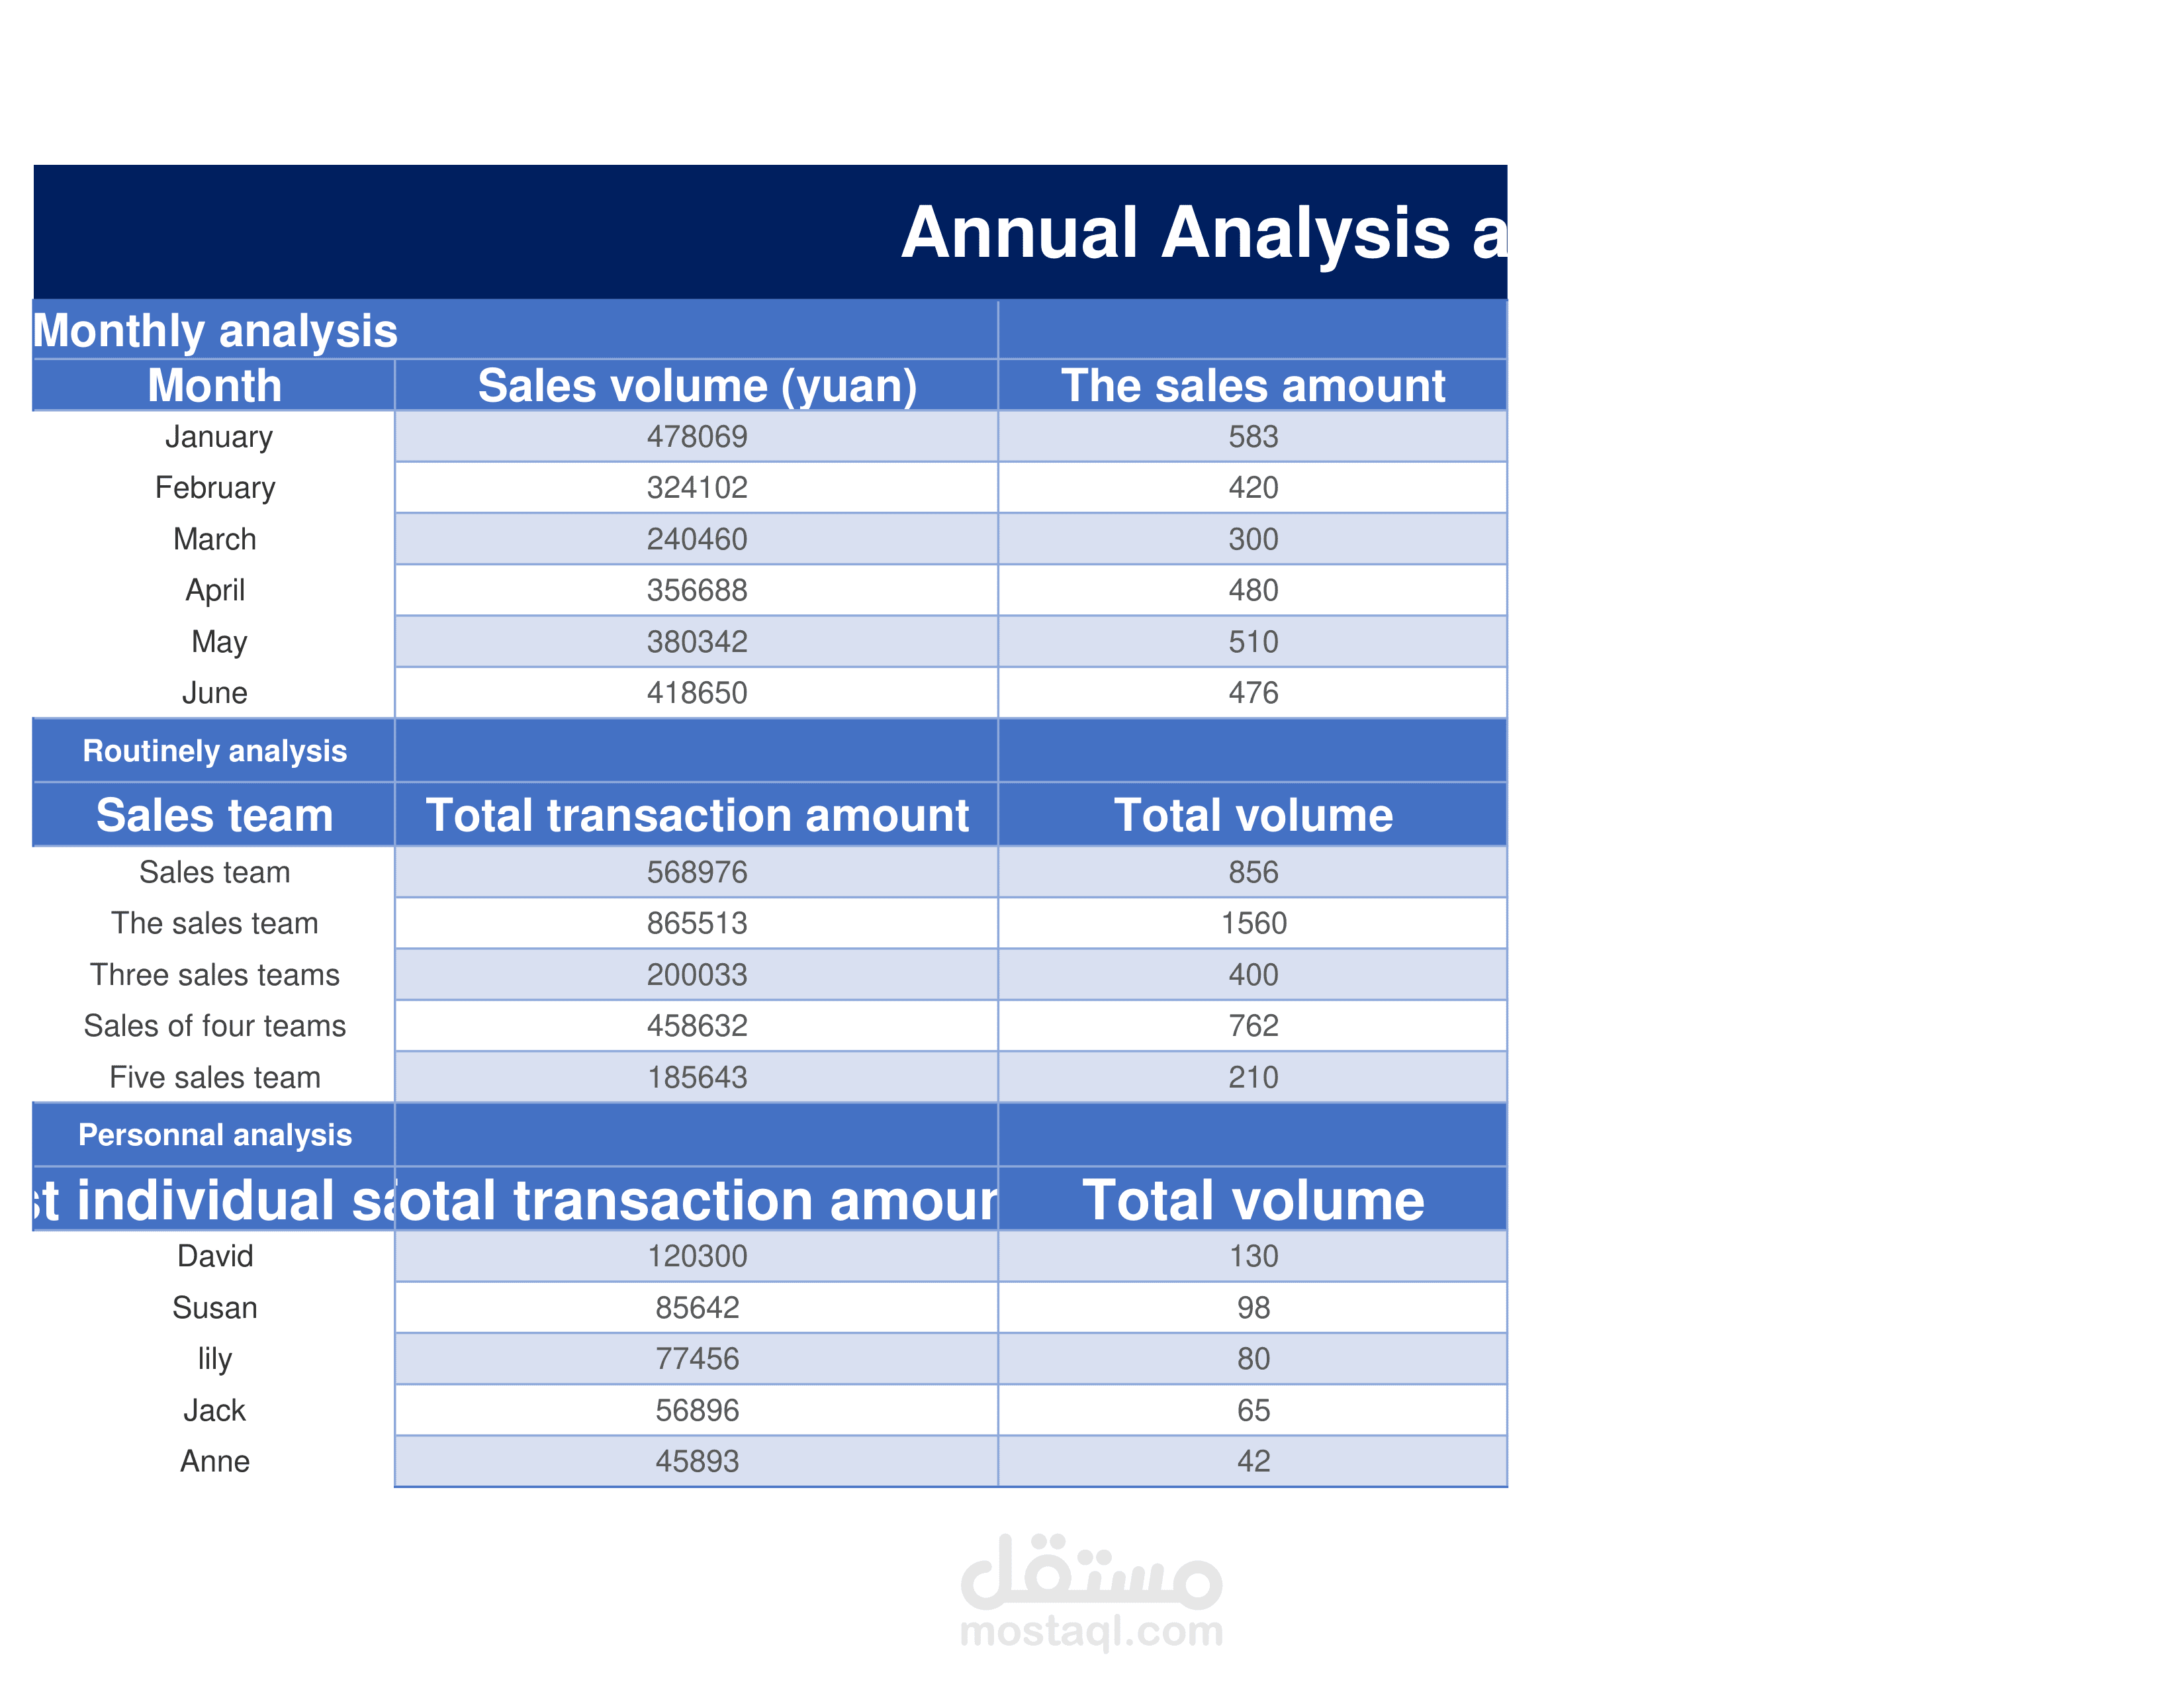

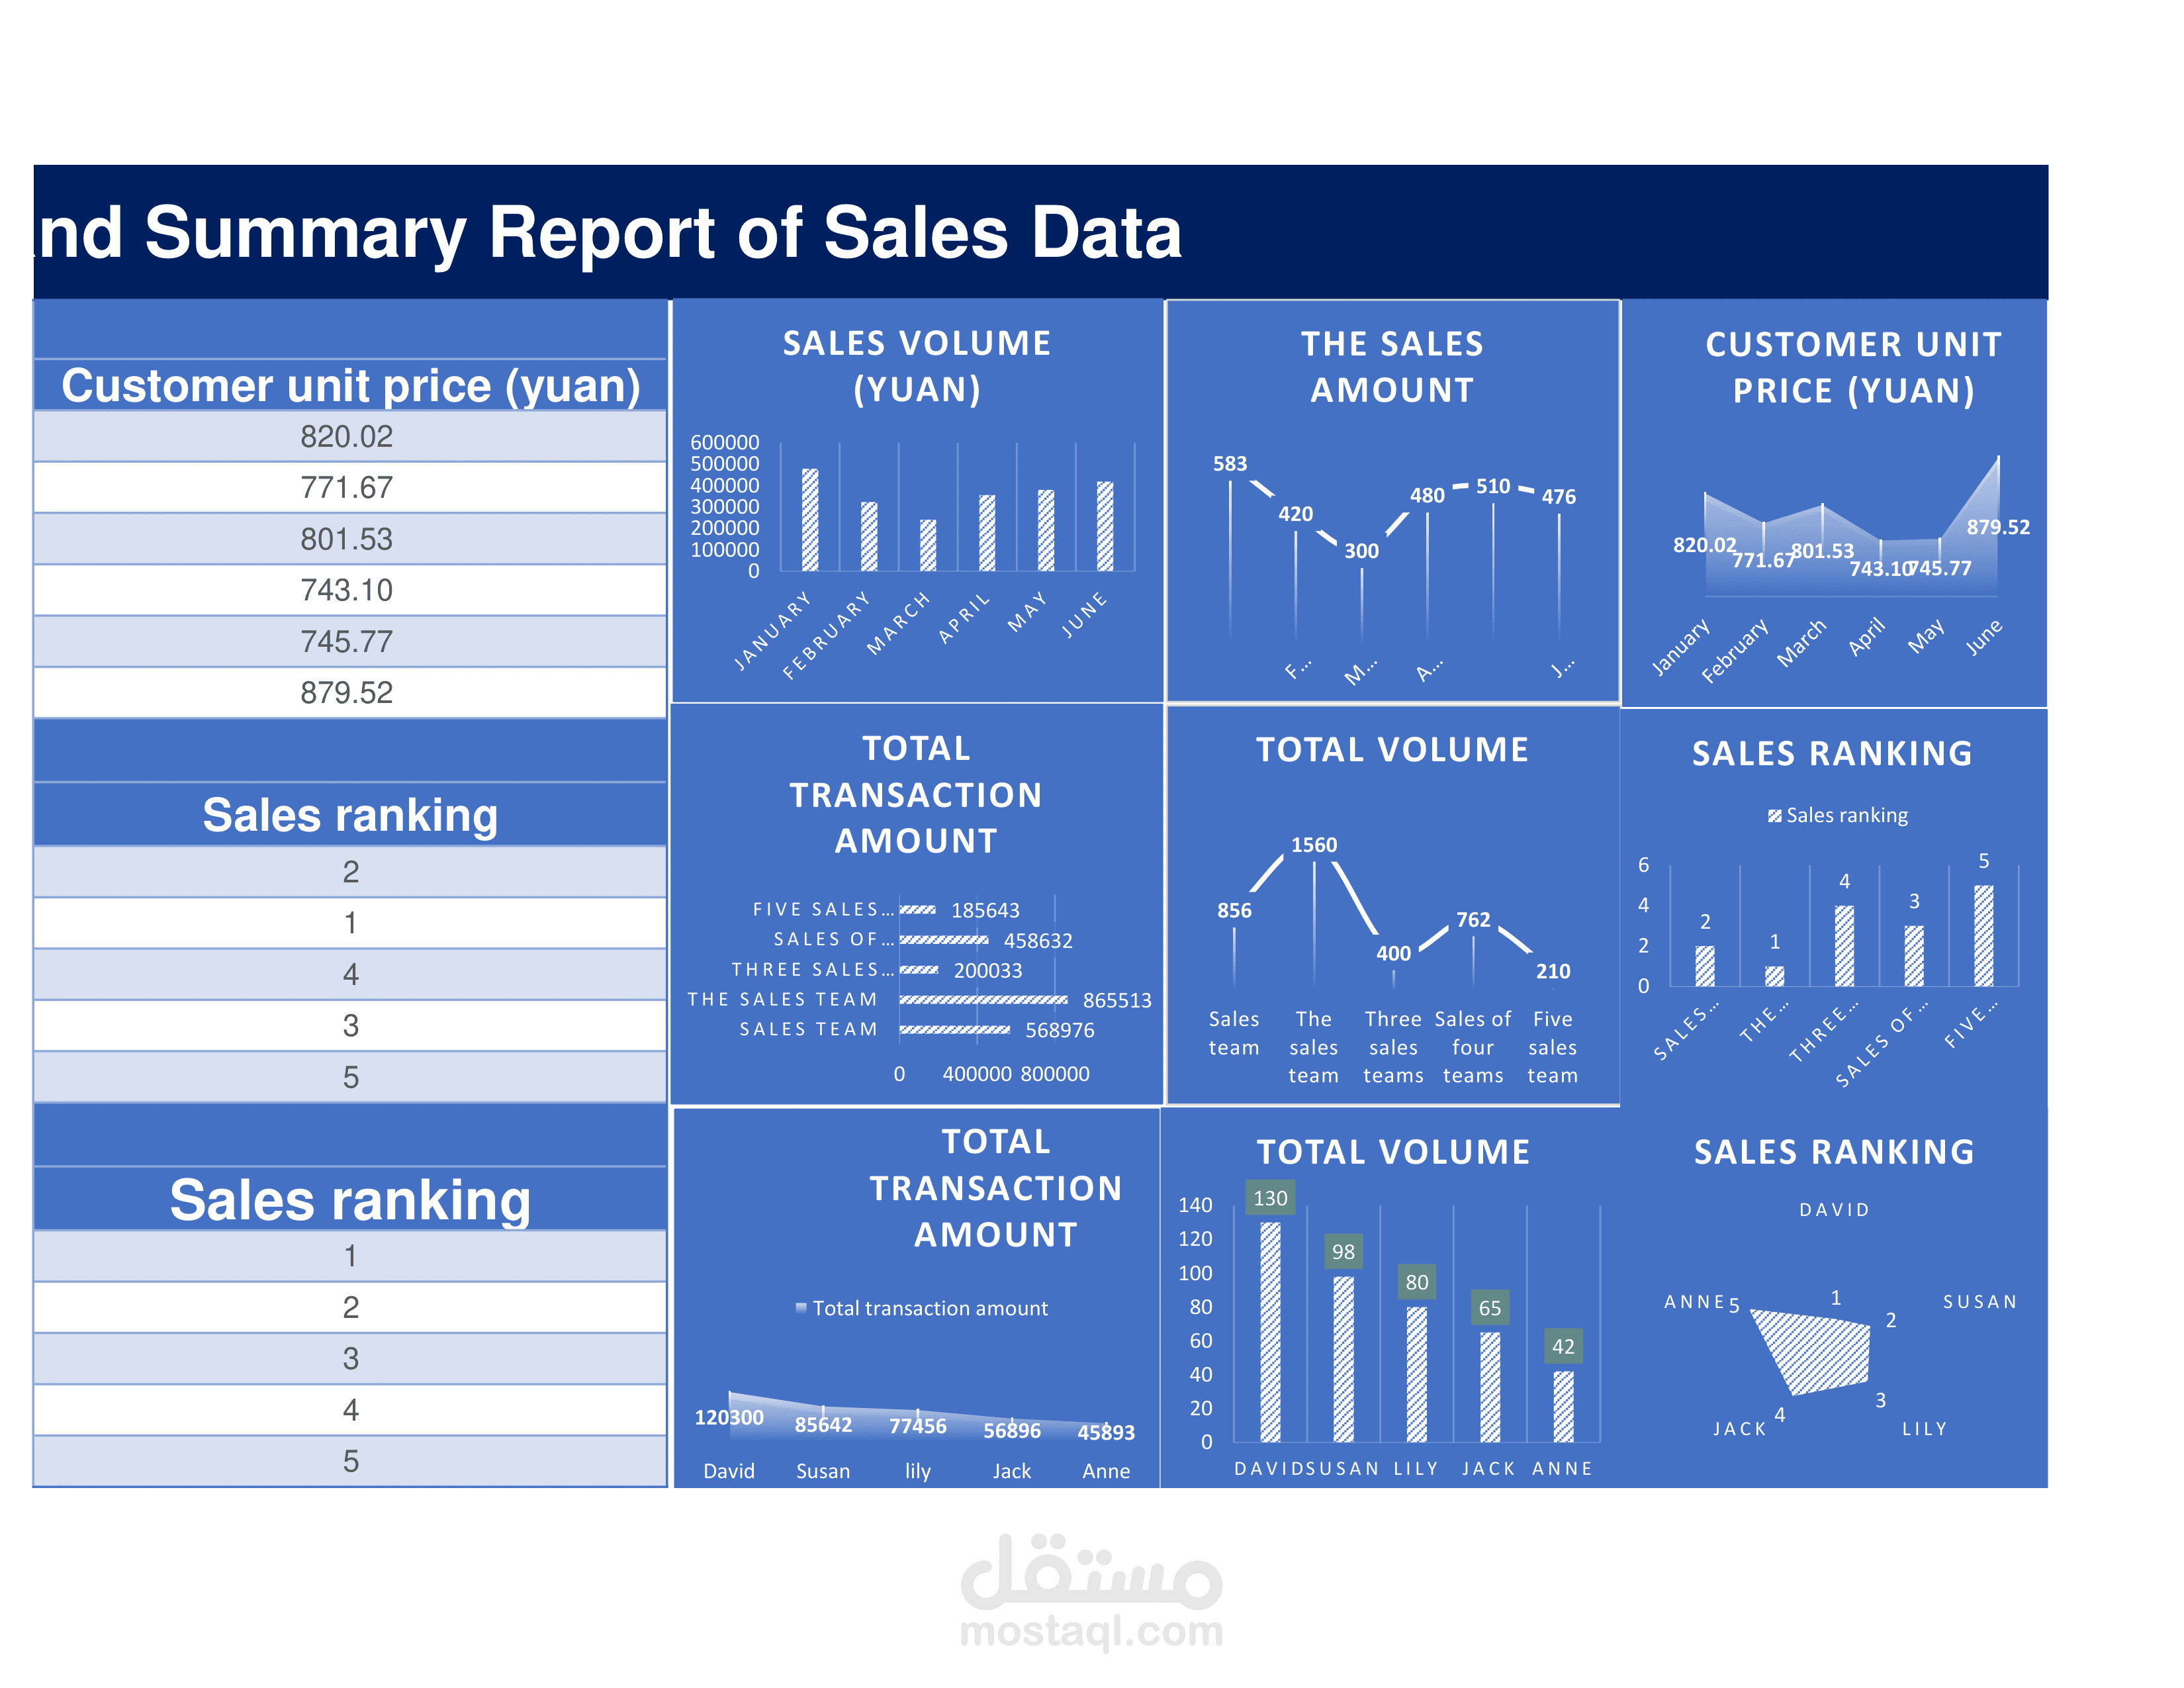
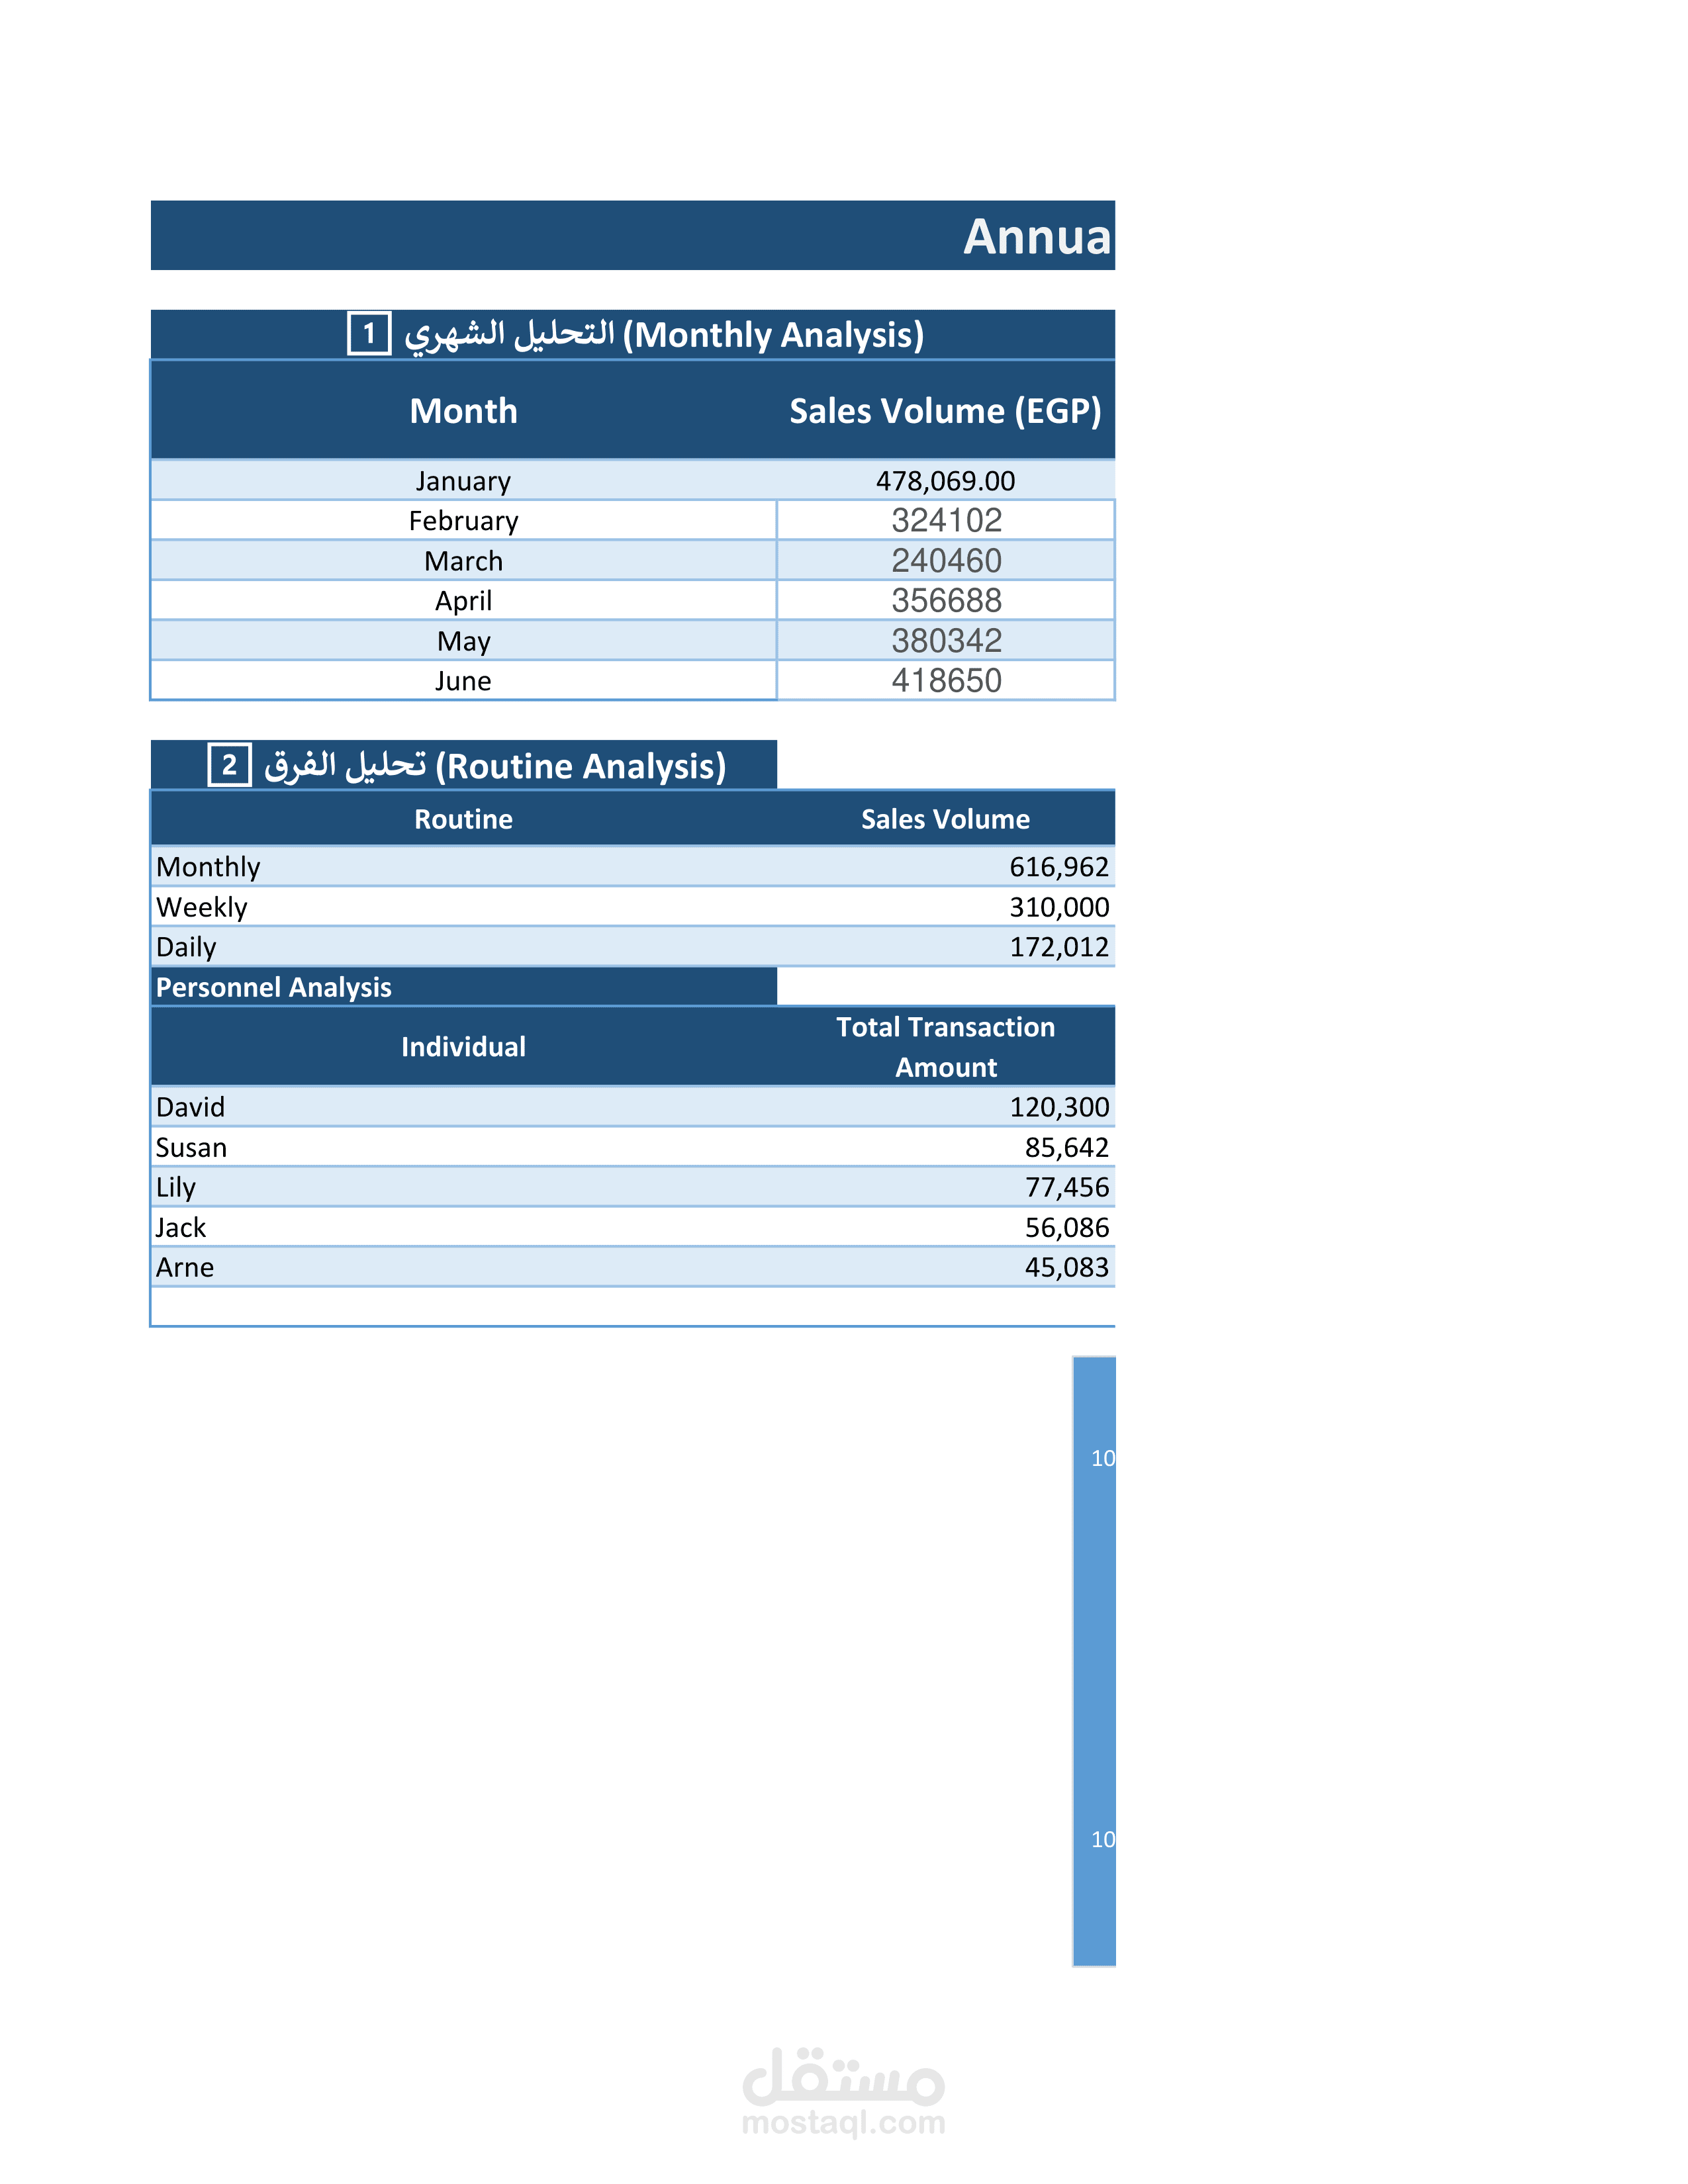
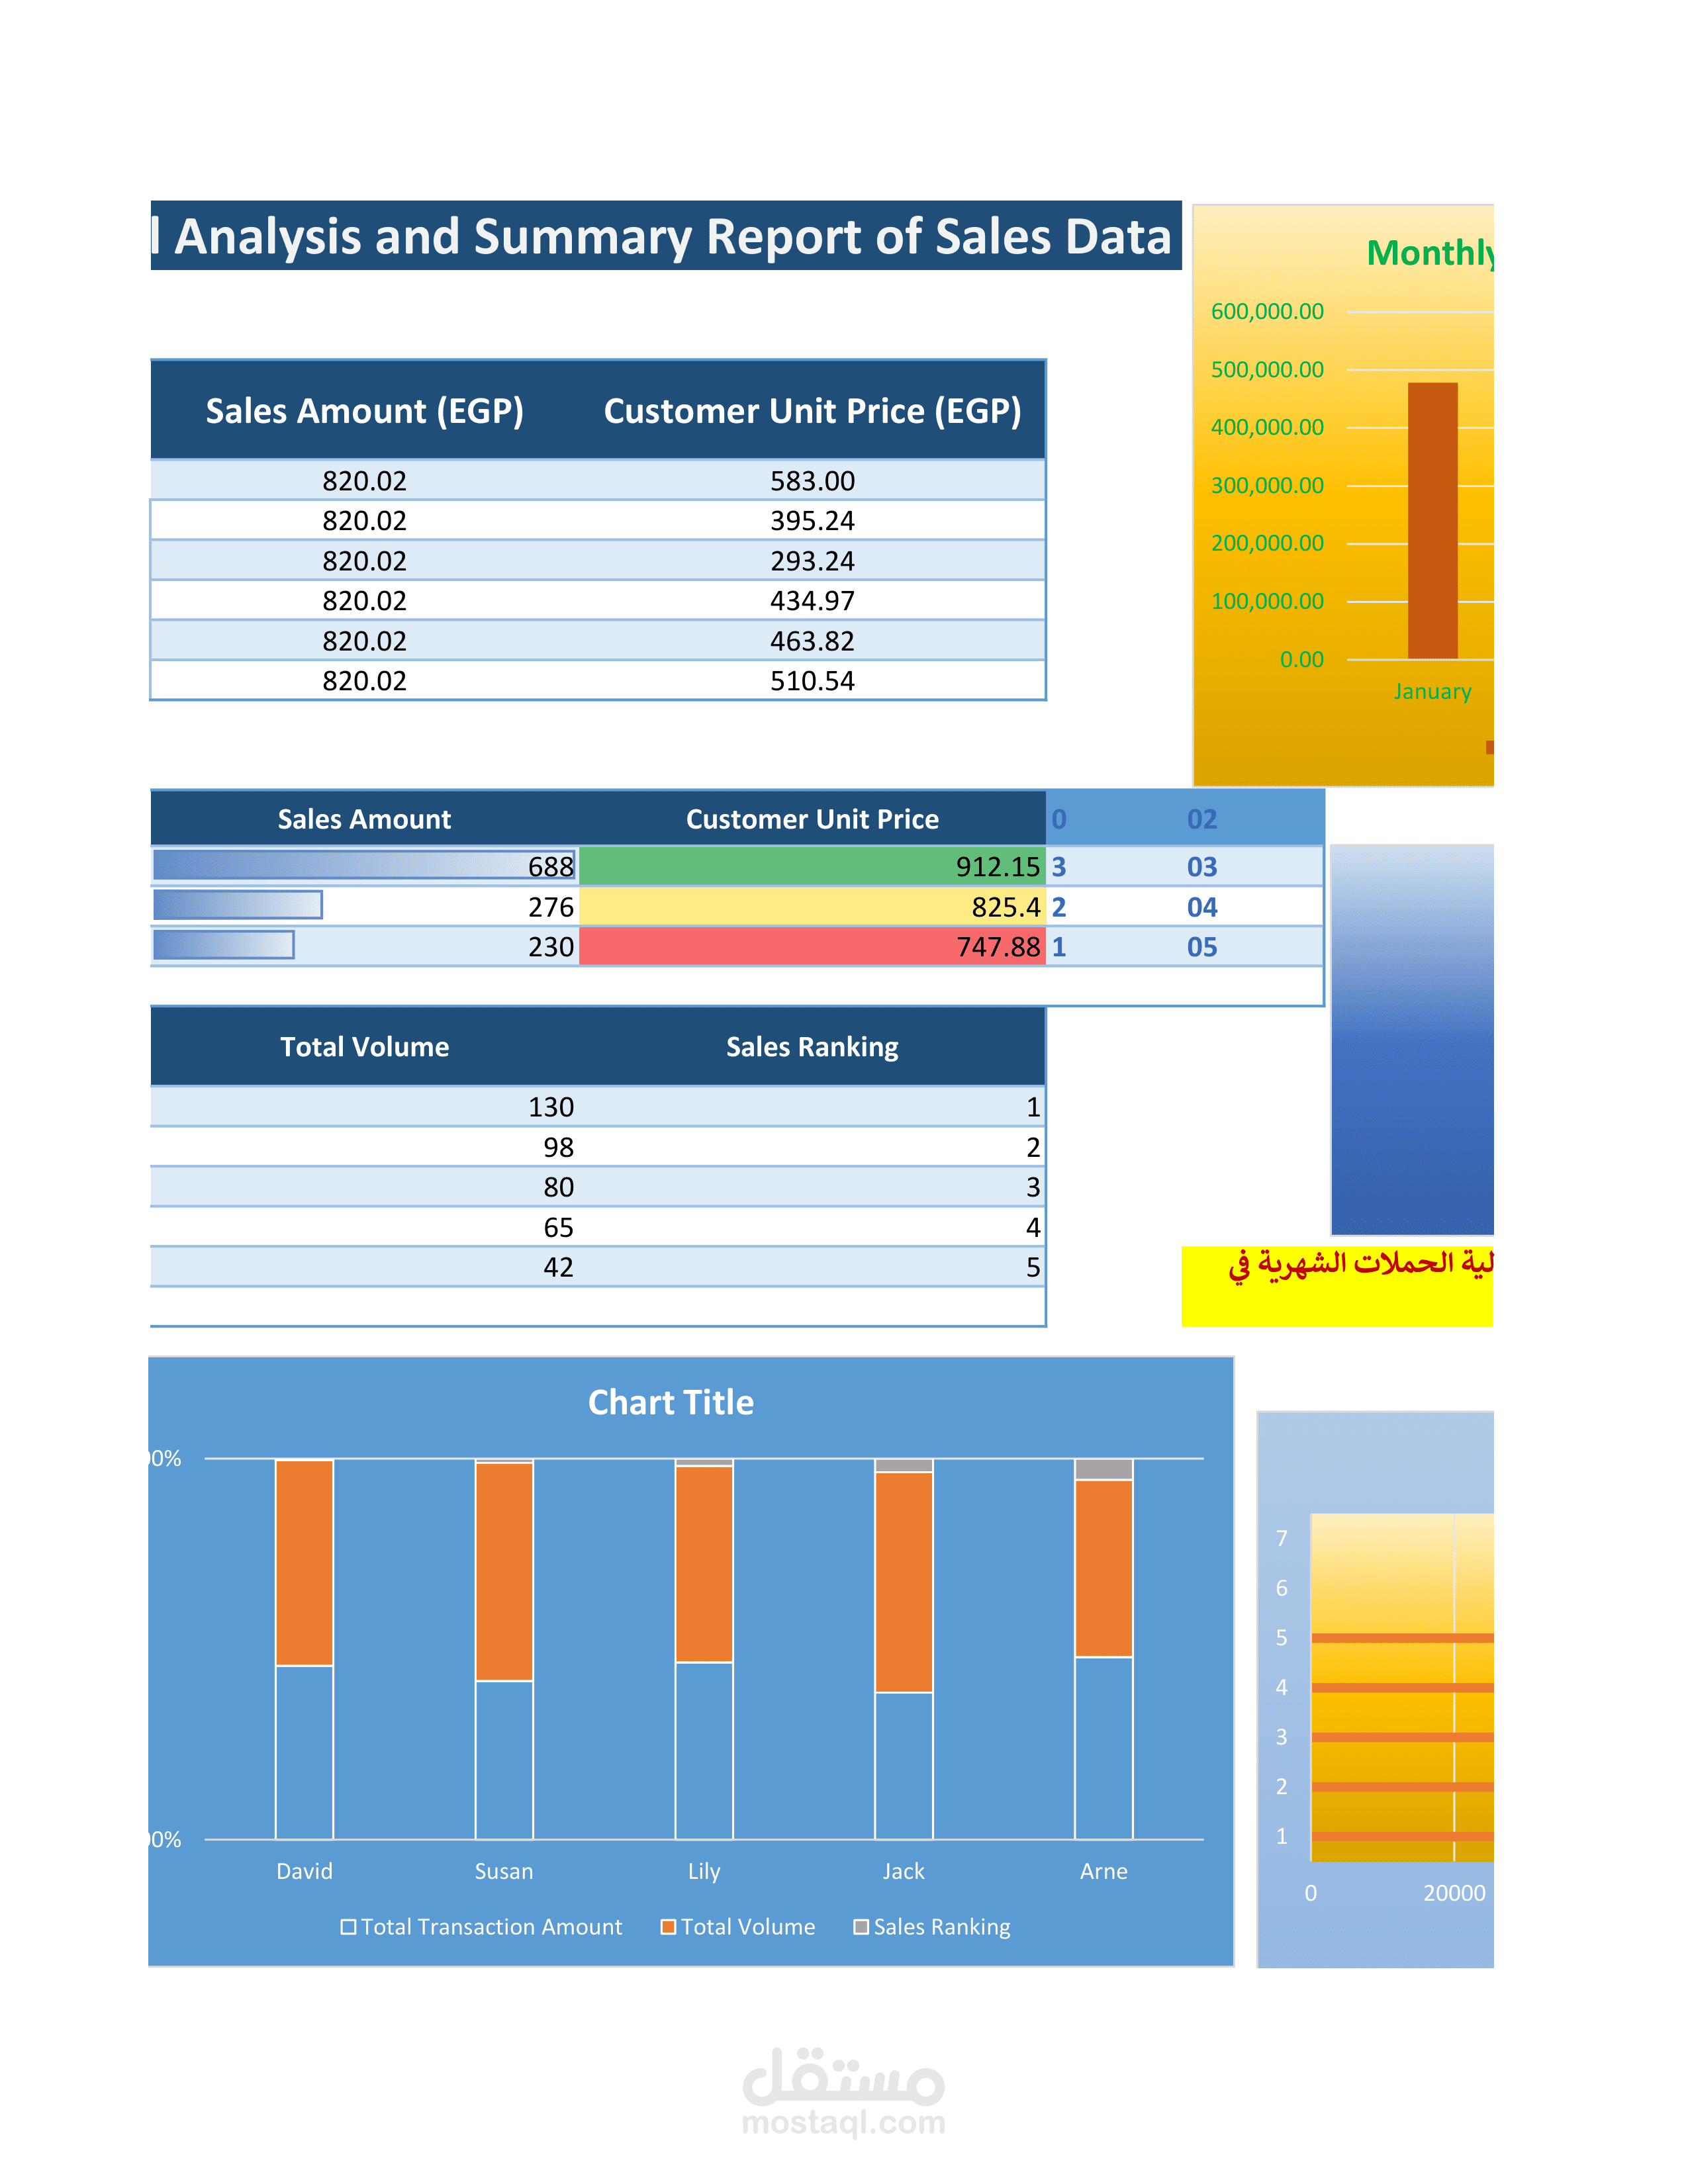
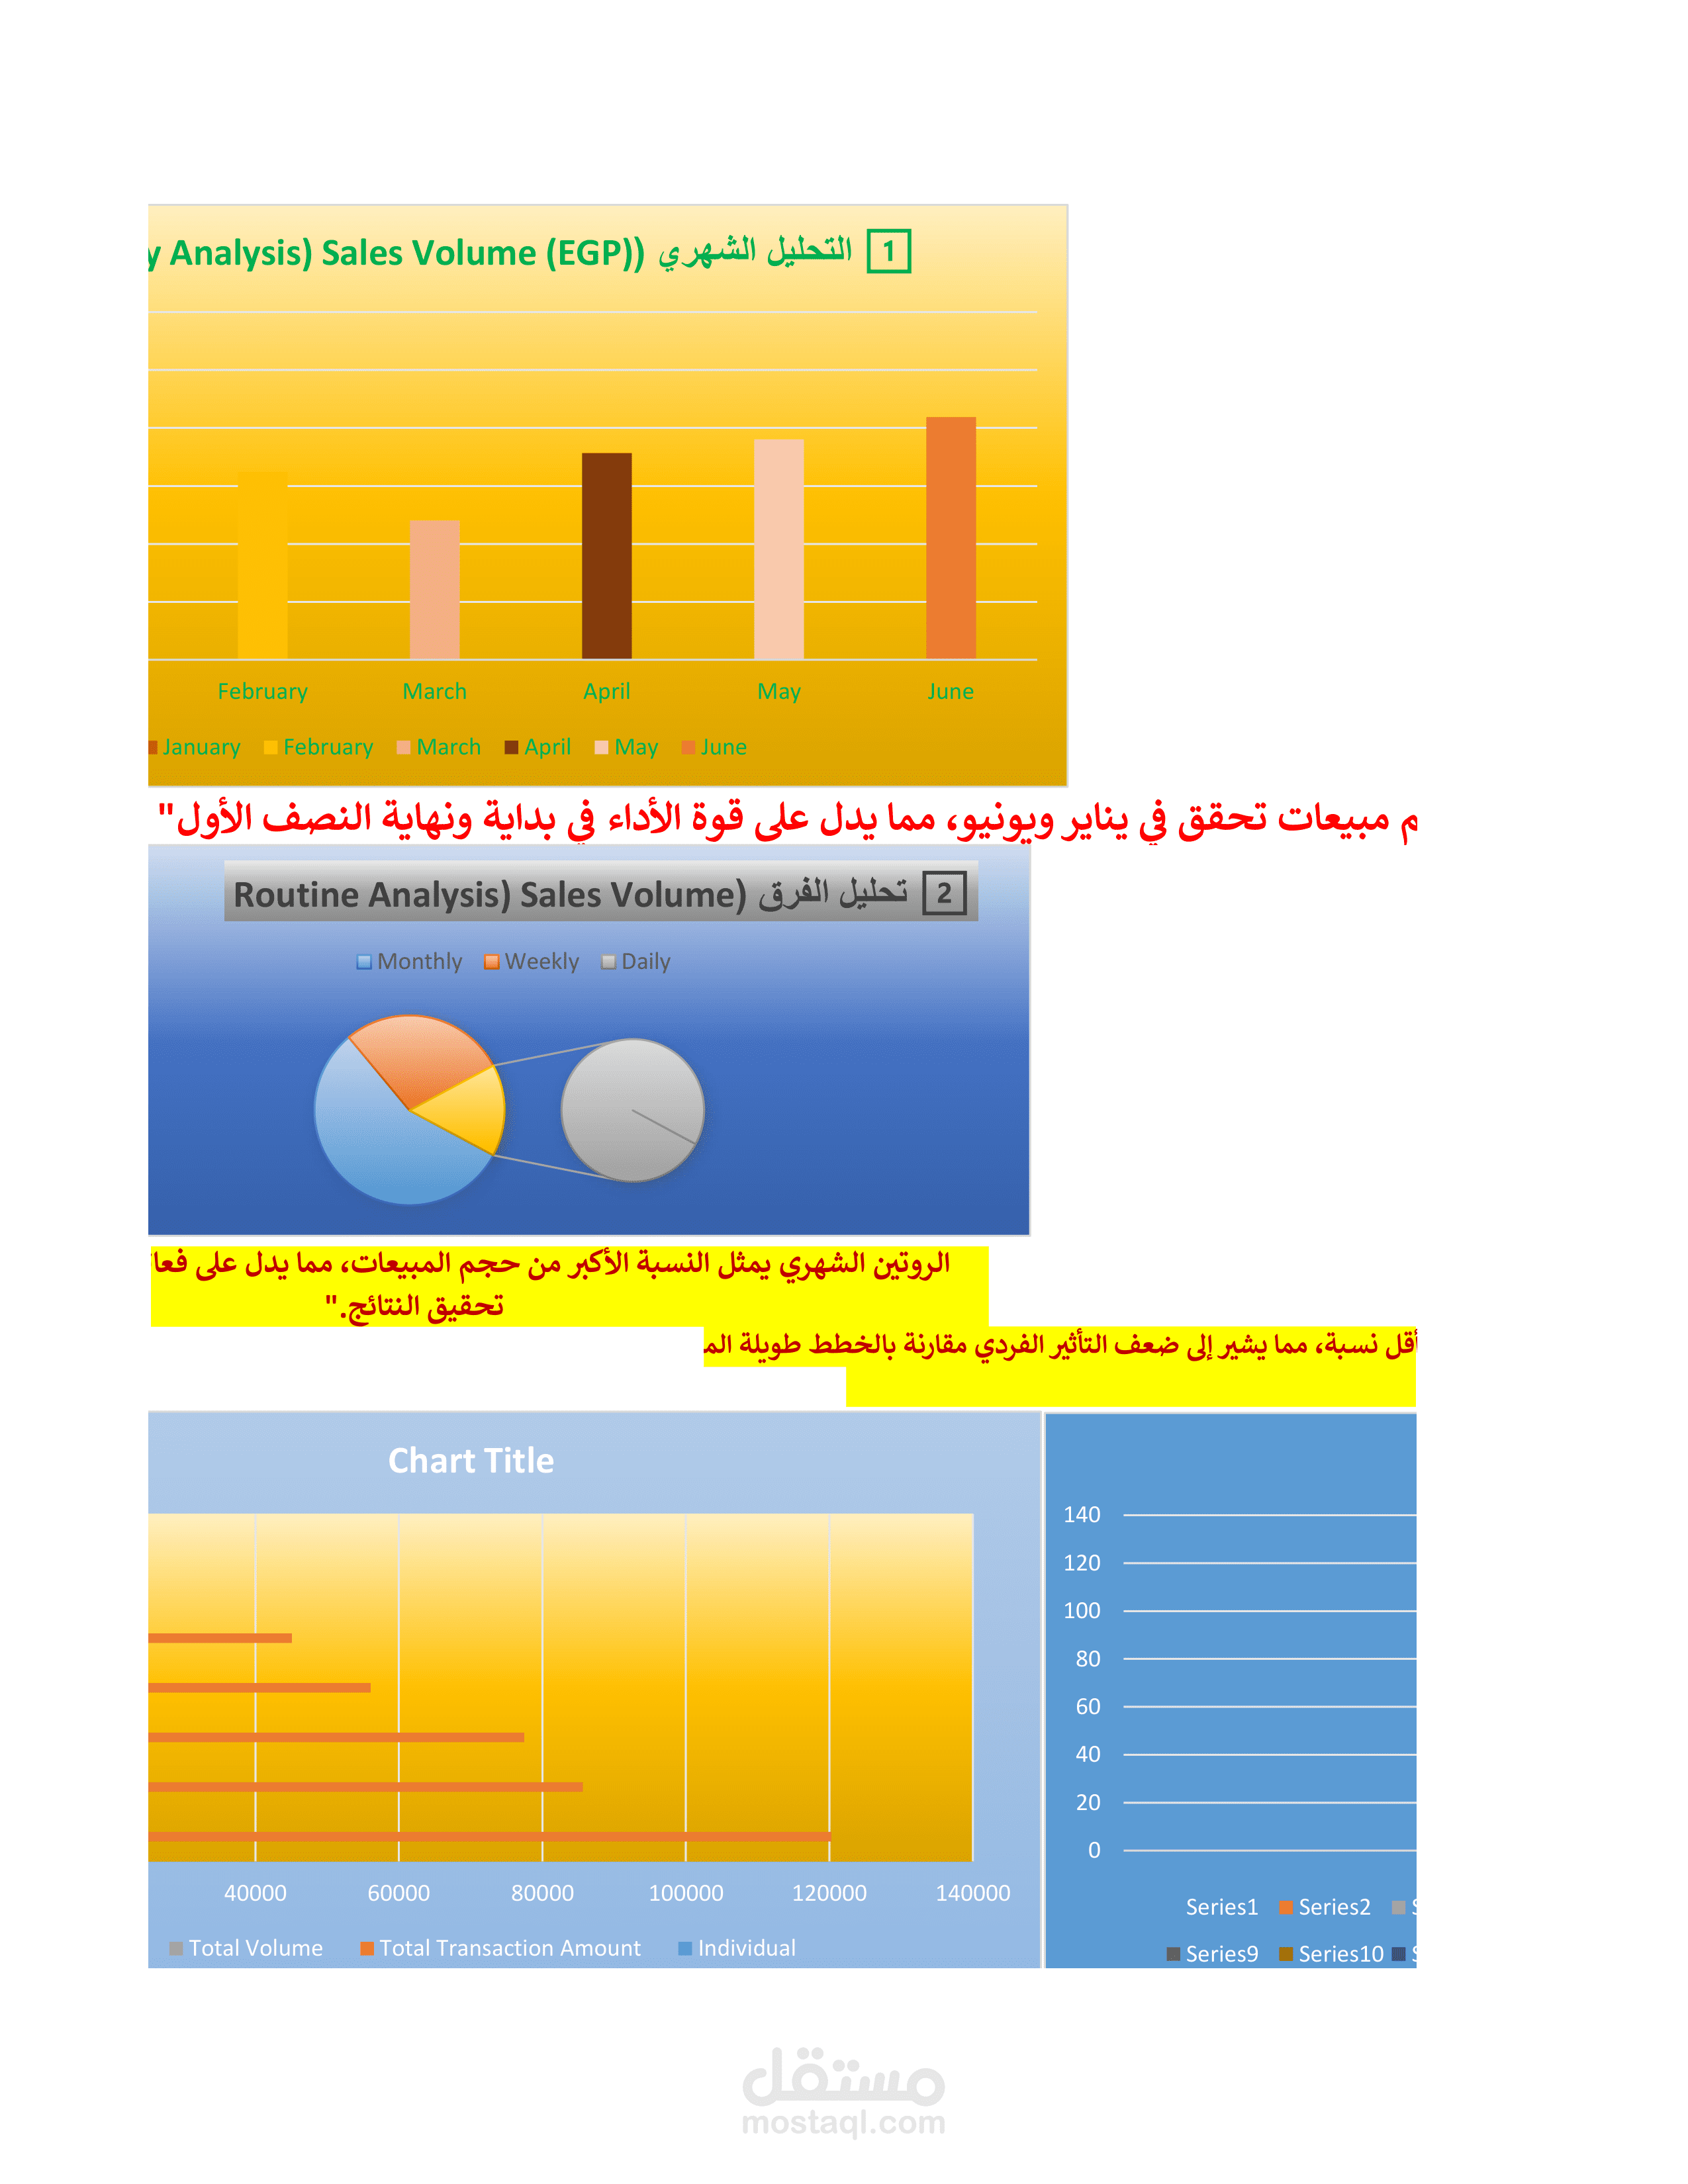
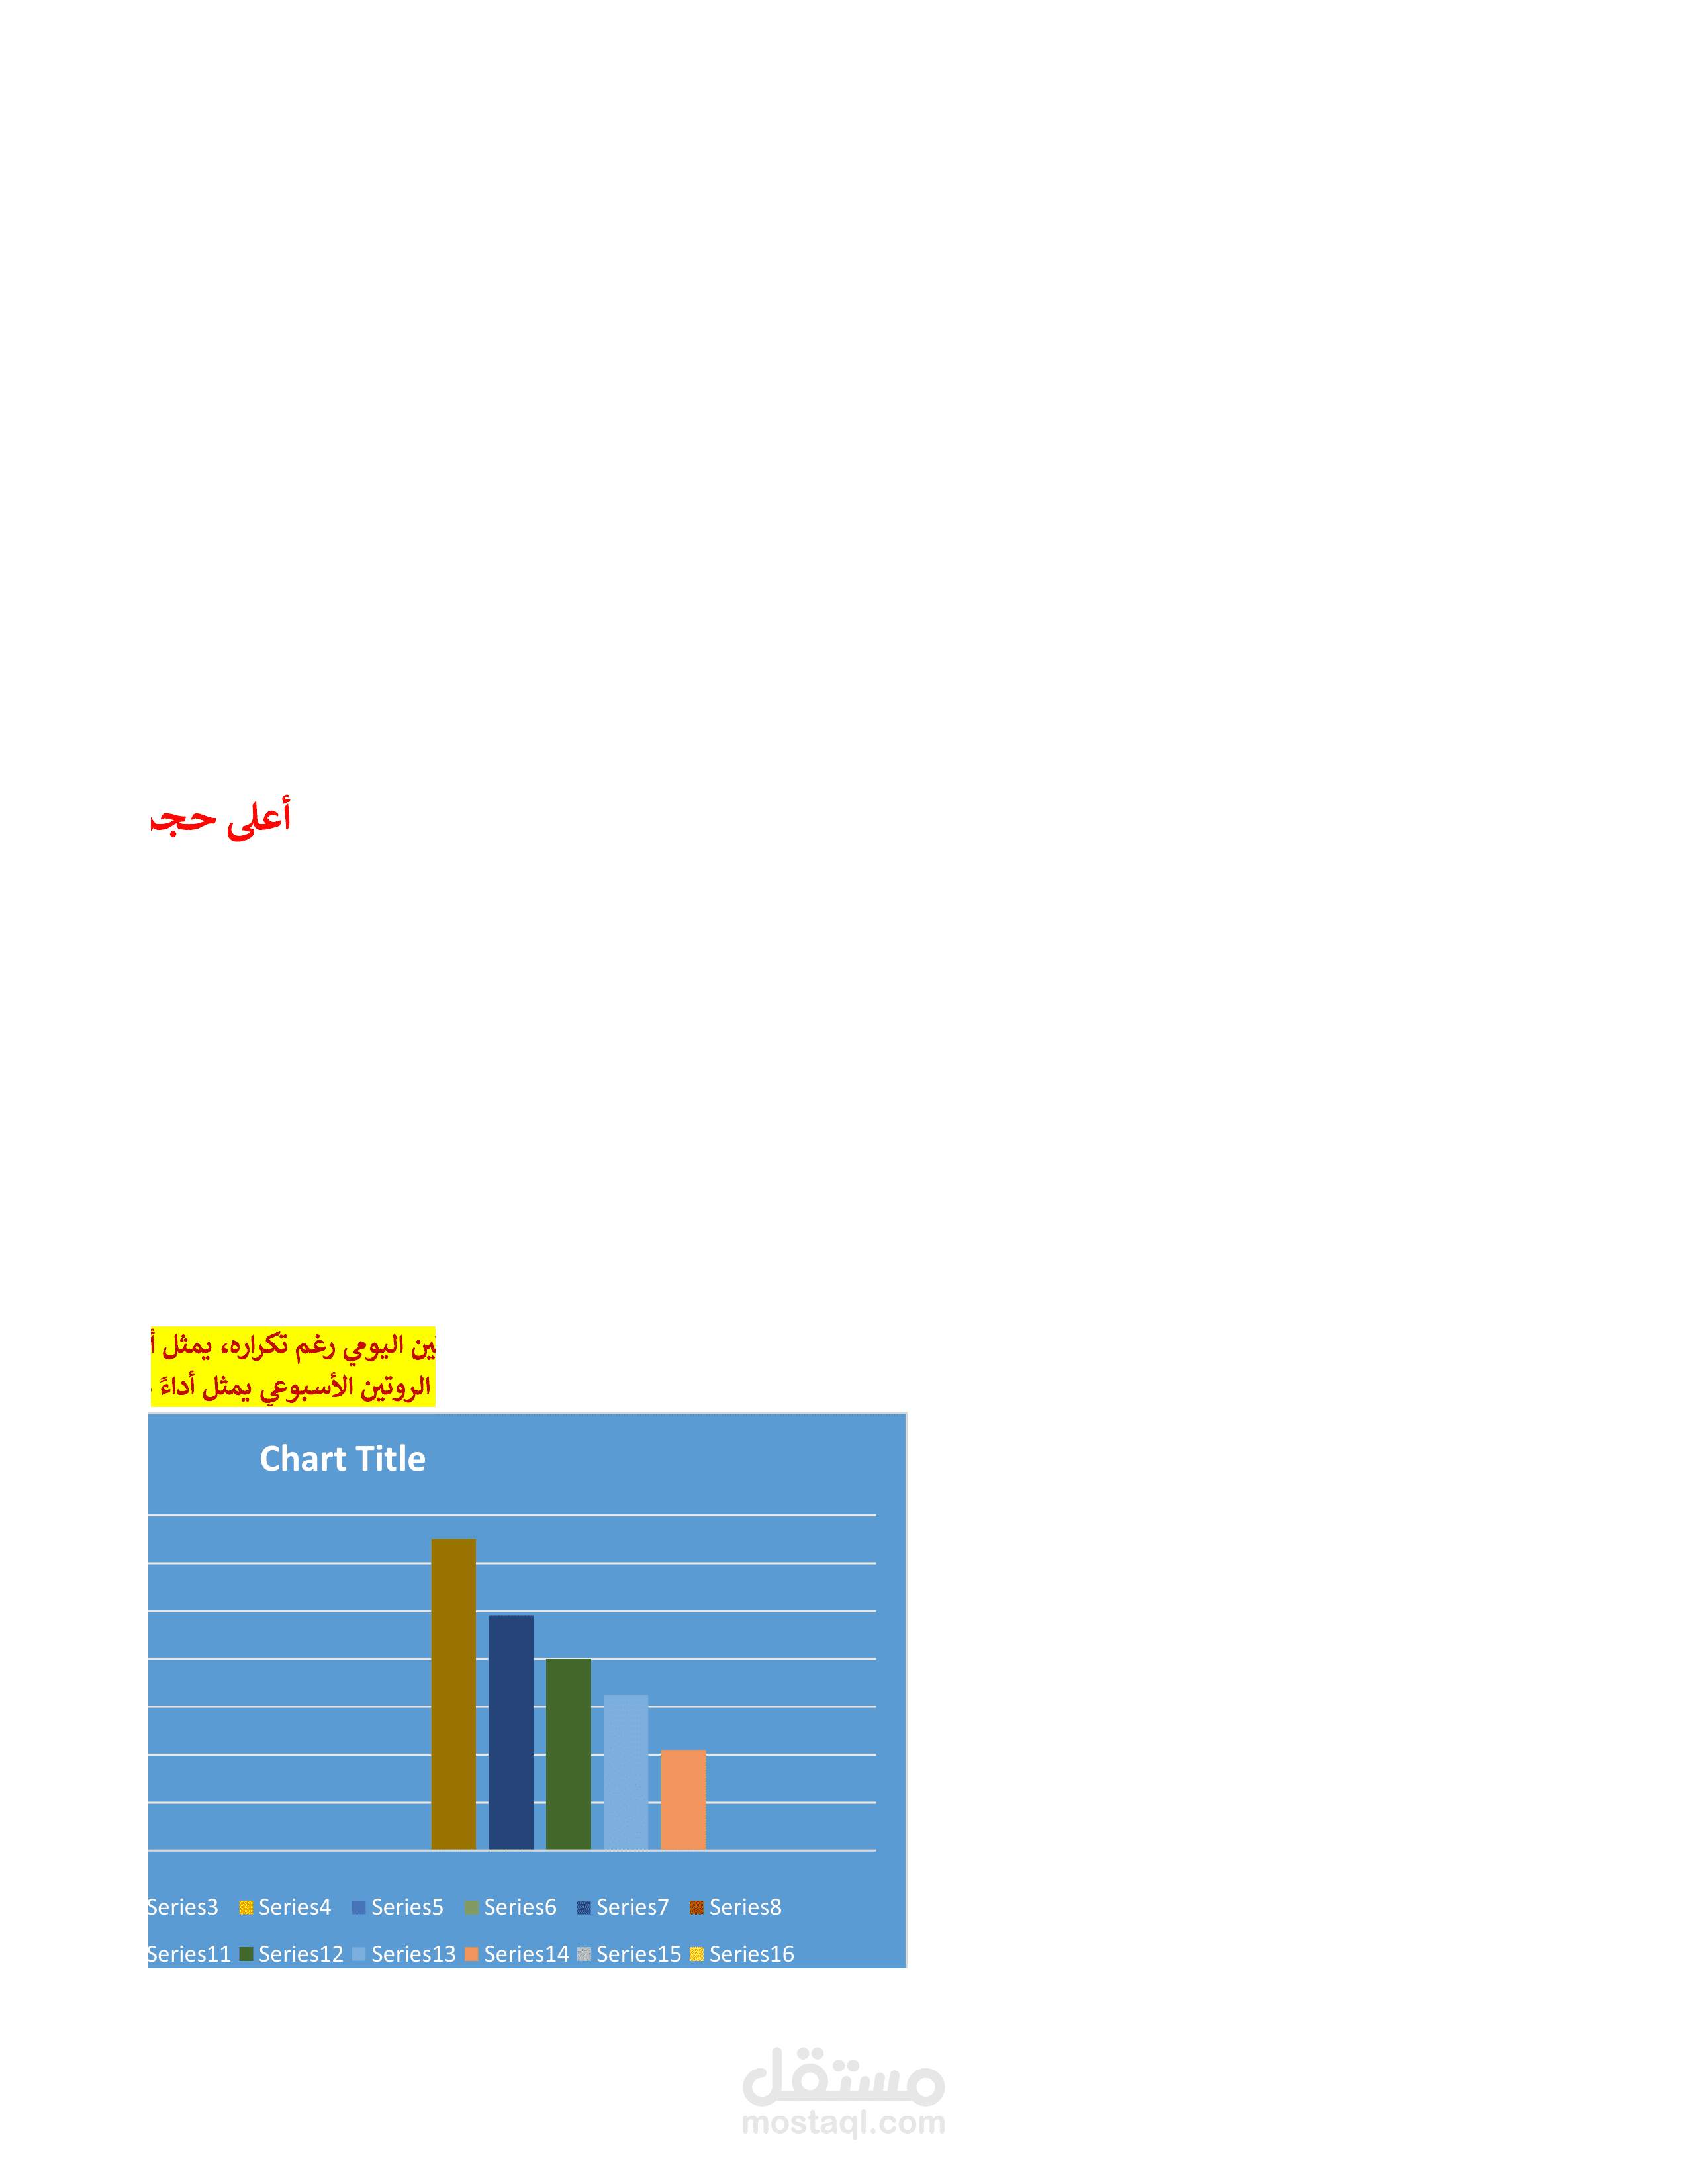
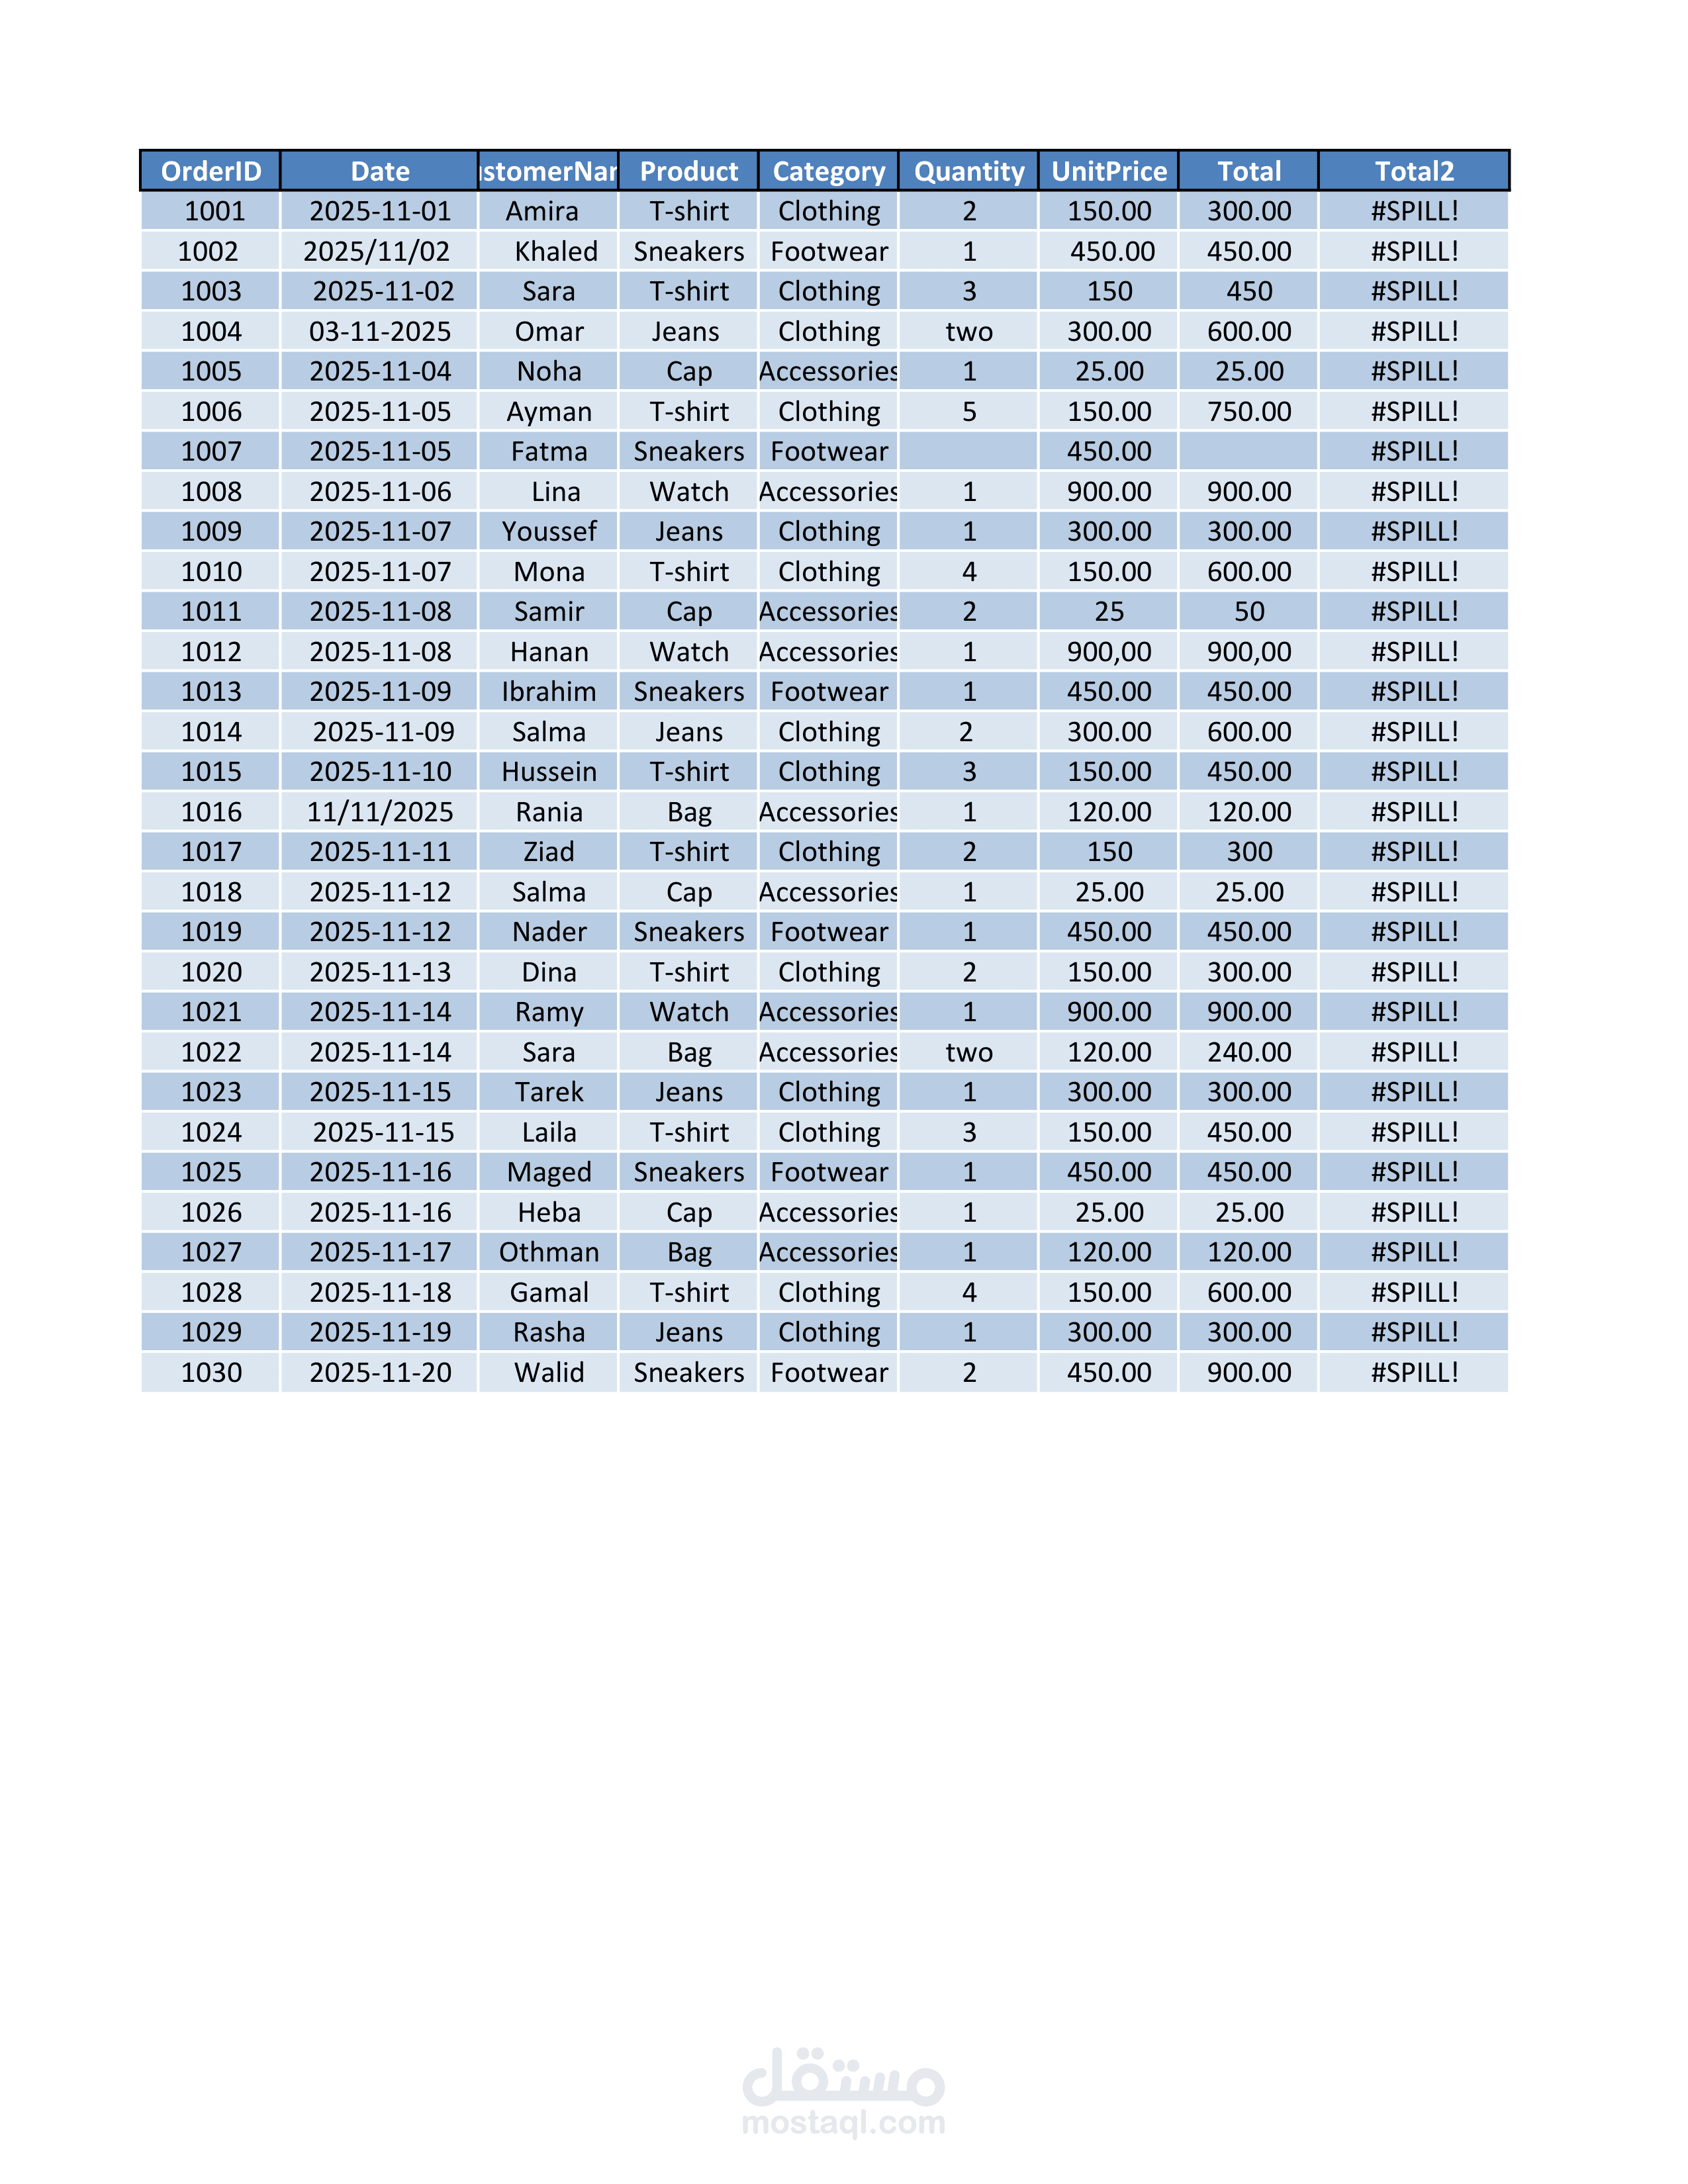
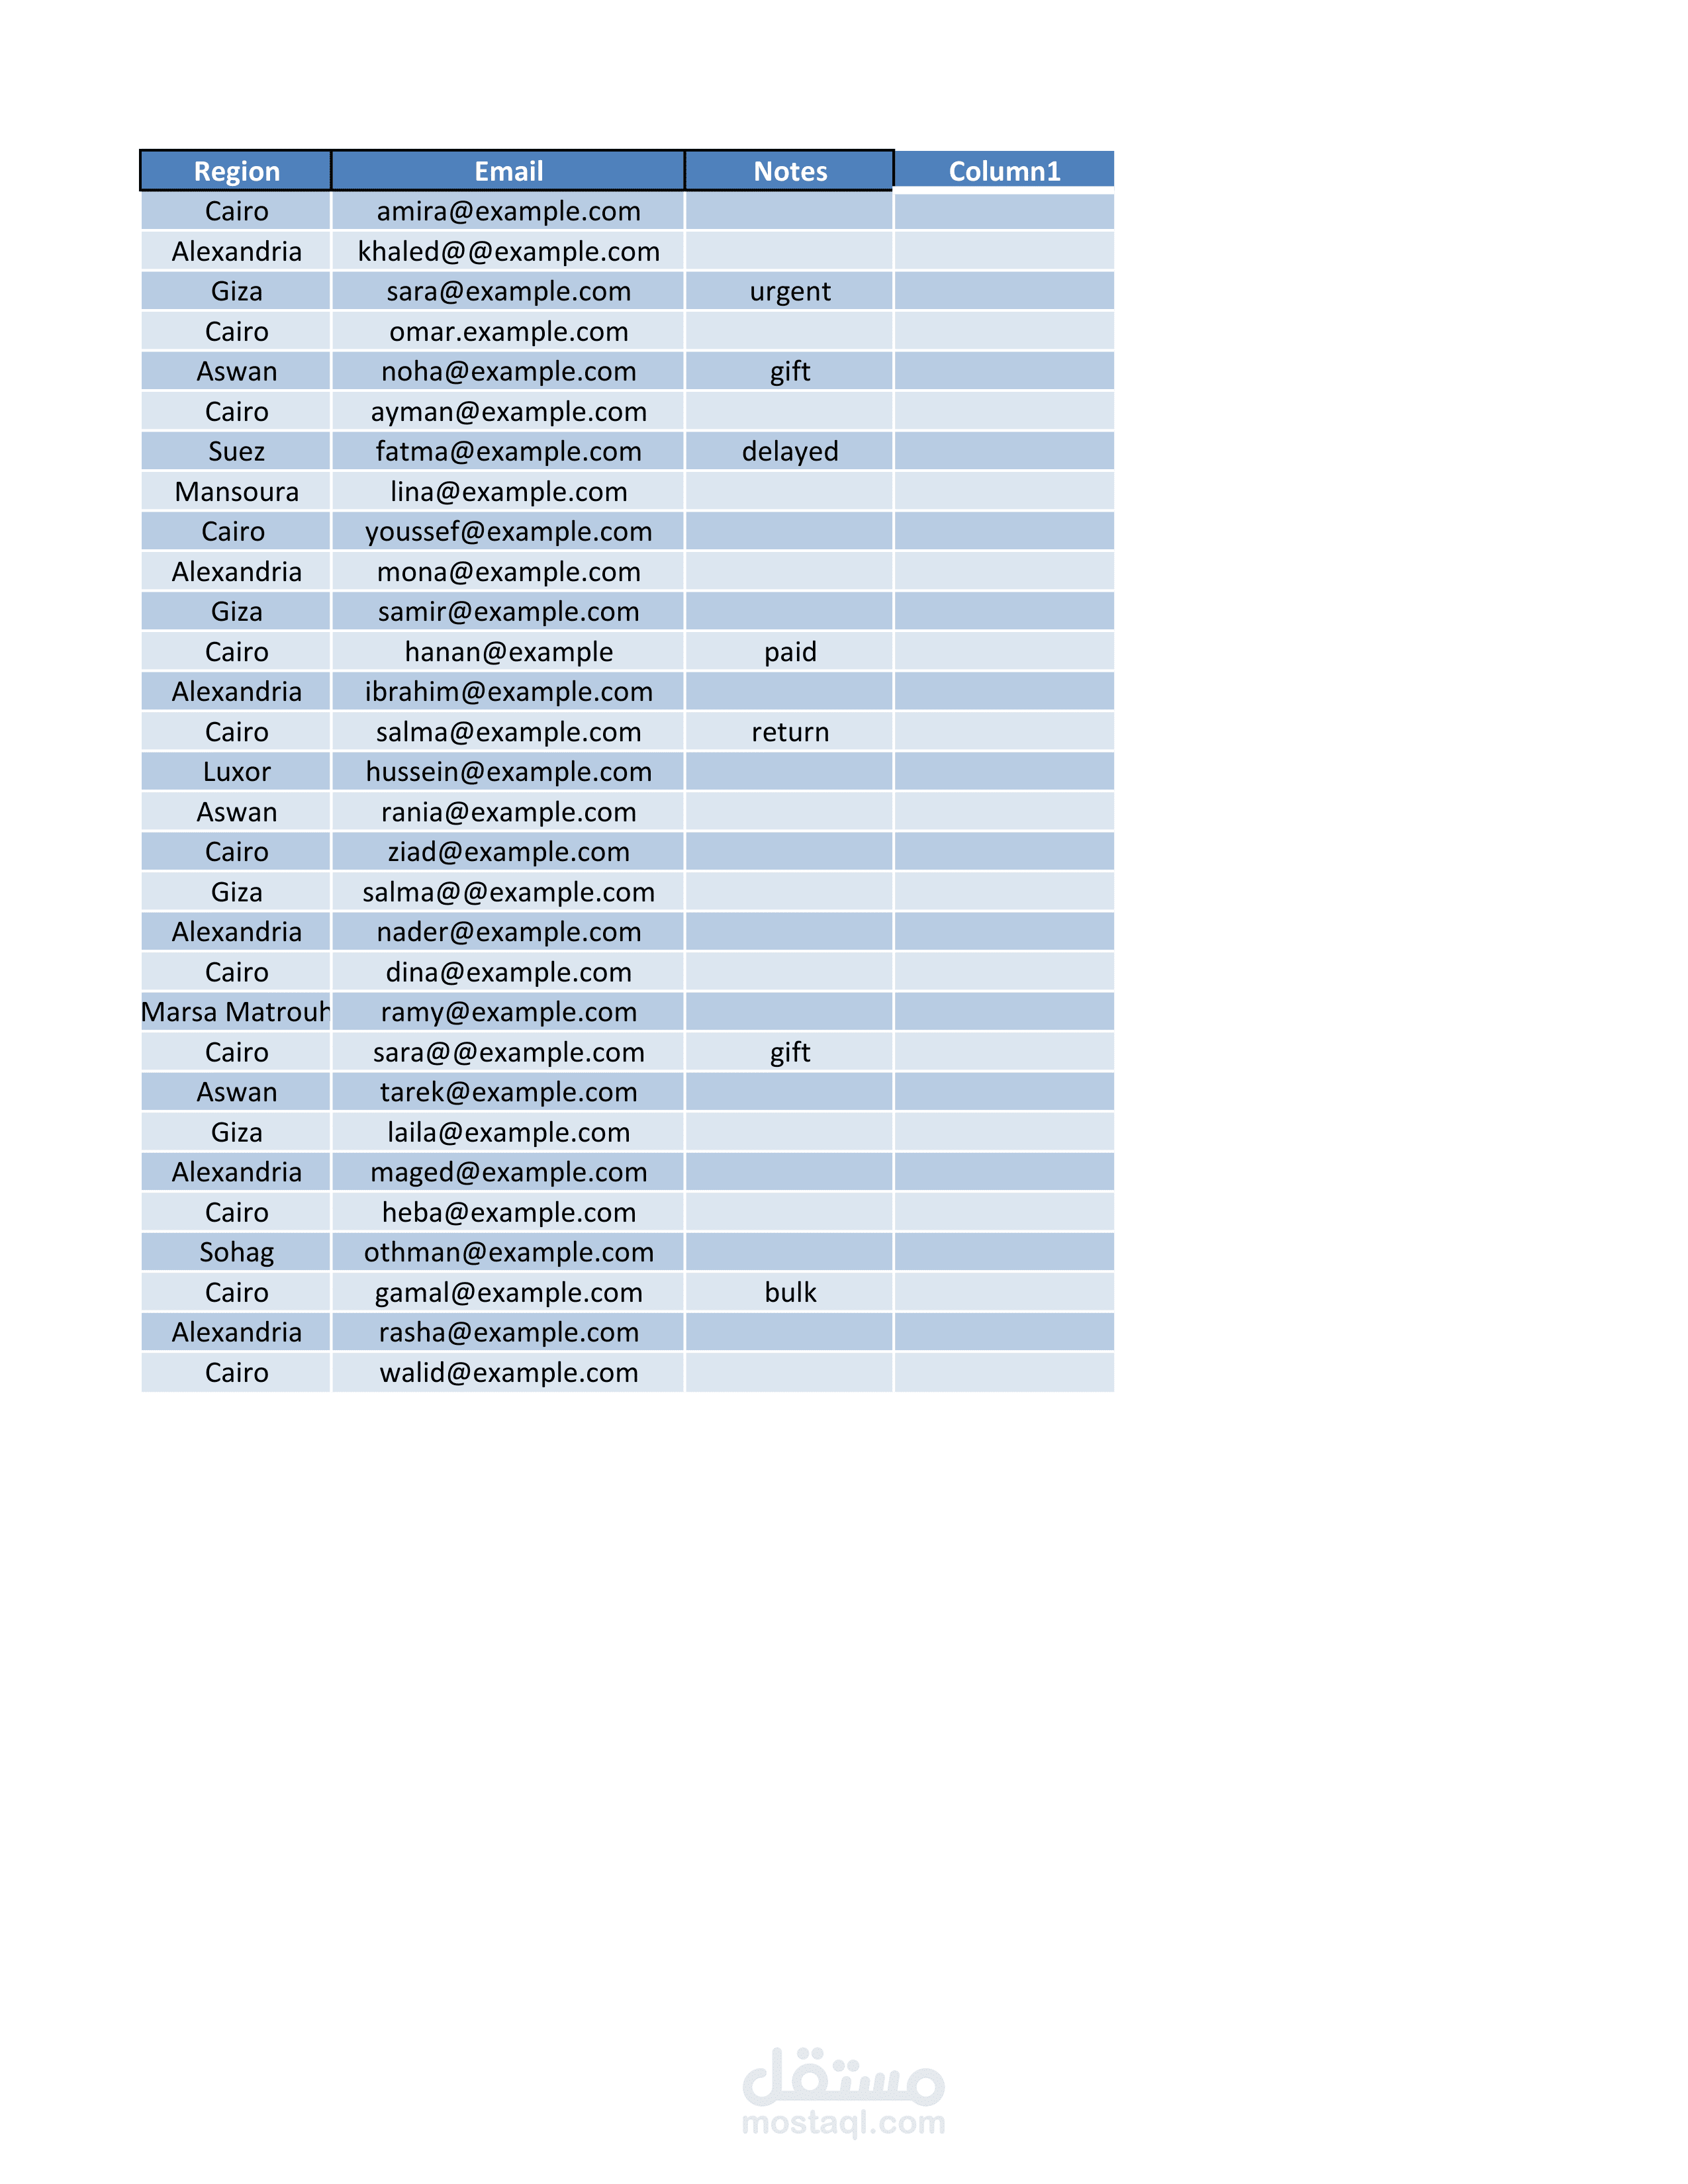
This project presents an annual analysis and summary report of sales data, visualized through dashboards and charts. It includes key performance indicators (KPIs), monthly trends, and comparative insights to support strategic decision-making. Tools used: Excel (PivotTables, Power Query), with a focus on clarity, accuracy, and business impact.