Dashboard Retail Sales & Purchasing
تفاصيل العمل
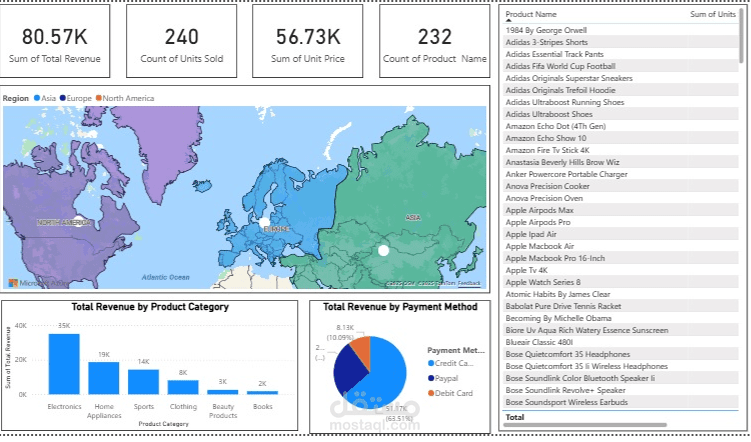
I developed as interactive Power BI dashboard to analyze retail sales and purchasing price trends across multiple years. The report provides detailed insights categorized by client, year, and product category. Key performance indicators (KPIs) such as total sales, total cost, profit margin, and yearly growth as visualized using dynamic charts and slicers.