Sales_Dashboard_Using_Excel
تفاصيل العمل
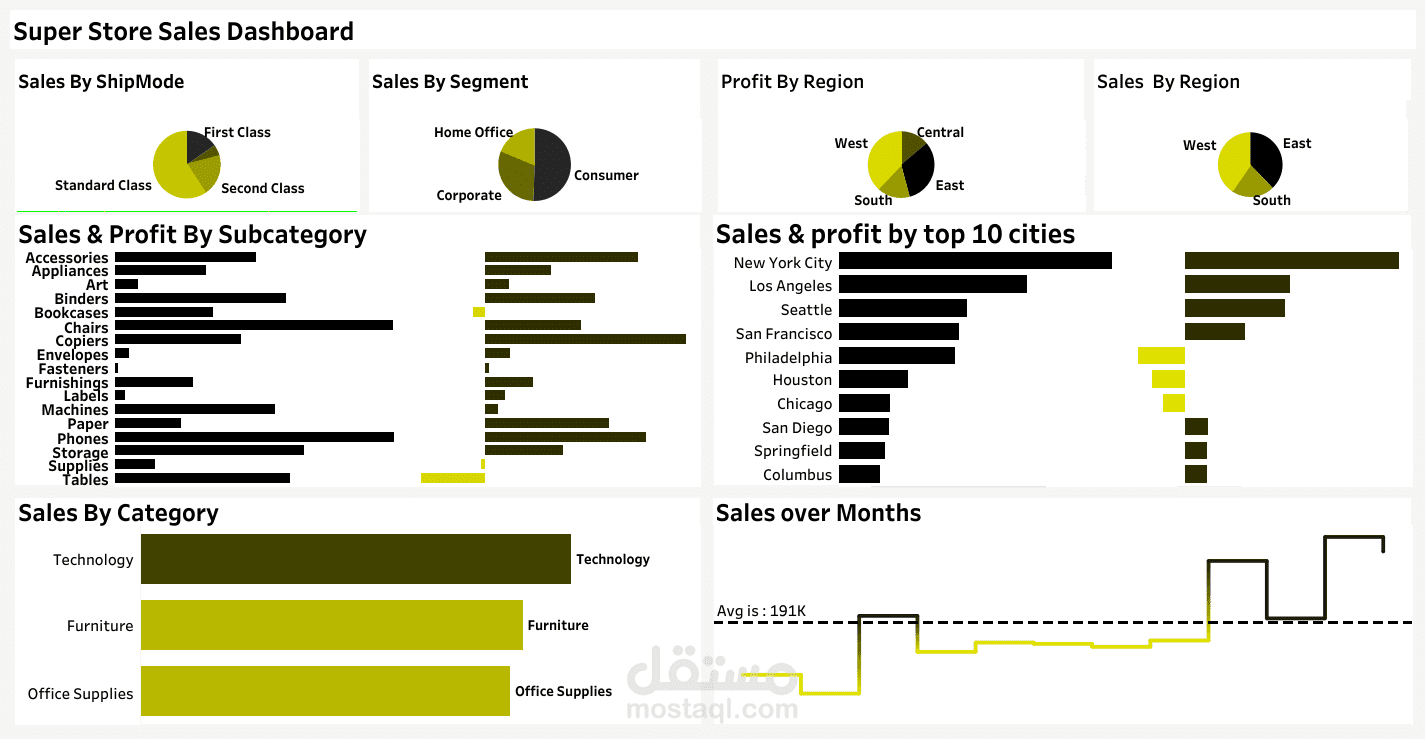
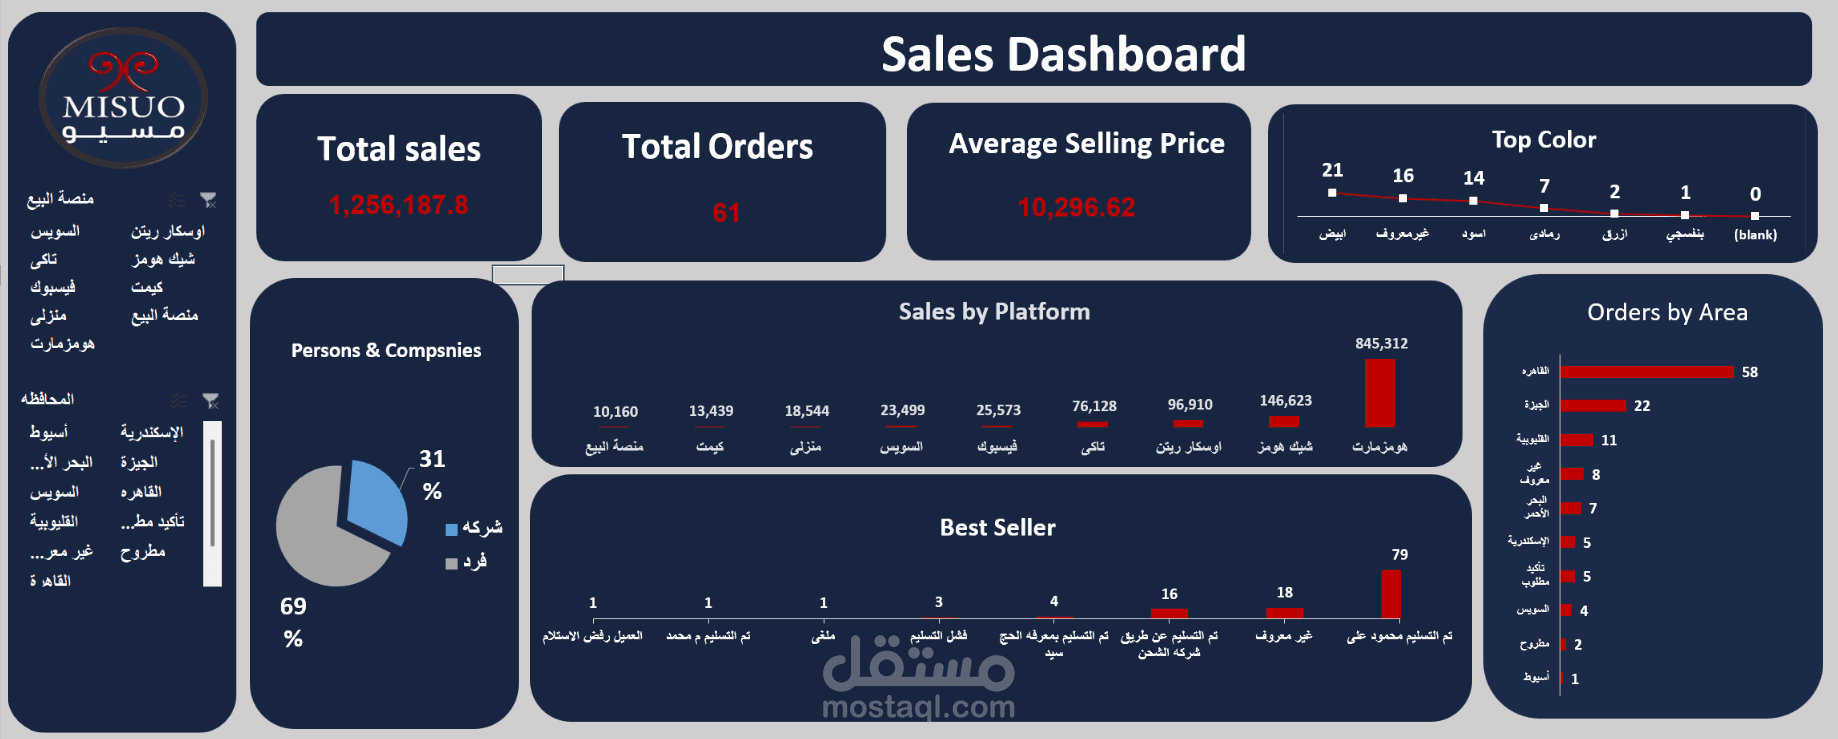
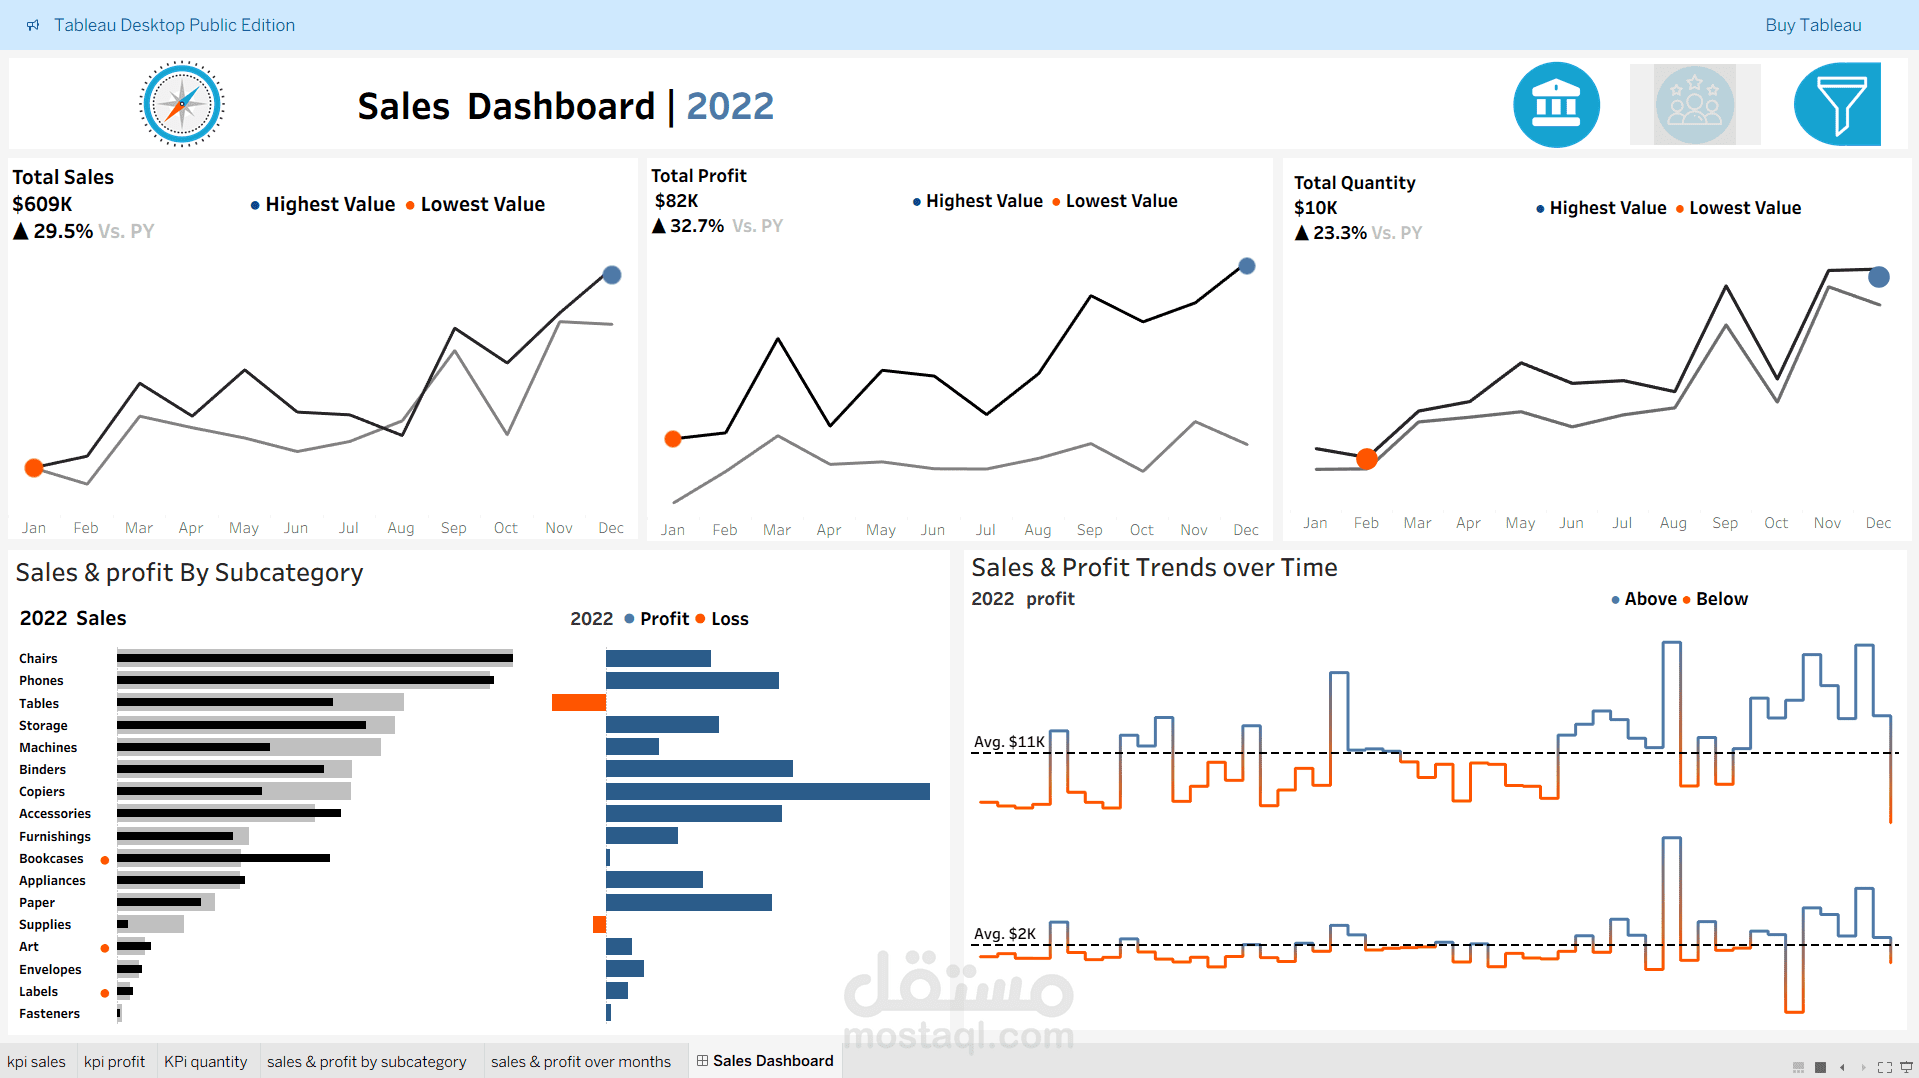
Sales Dashboard for Sales Analysis & Business Insights
Interactive Sales Dashboard built using Microsoft Excel to analyze sales performance, track orders, and monitor key business metrics. The dashboard provides valuable insights through clear KPIs such as Total Sales, Total Orders, Average Selling Price, Best Sellers, and Sales by Platform. Dynamic filters and visualizations make data exploration easier and support effective business analysis.
Tools Used:
Microsoft Excel
Power Query
Pivot Tables
Key Features:
Interactive and dynamic filters for better data exploration
Sales performance analysis and KPI tracking
Total Sales, Total Orders, and Average Selling Price insights
Sales analysis by platform
Best seller tracking and performance monitoring
Order distribution analysis by area/location
Clean, modern, and user-friendly dashboard design
Easy-to-understand visual reports for decision making
This dashboard helps businesses monitor performance, gain actionable insights, and make smarter decisions to improve growth and profitability.