IT Support Ticketing System Dashboard
تفاصيل العمل
IT Support Ticketing System Dashboard
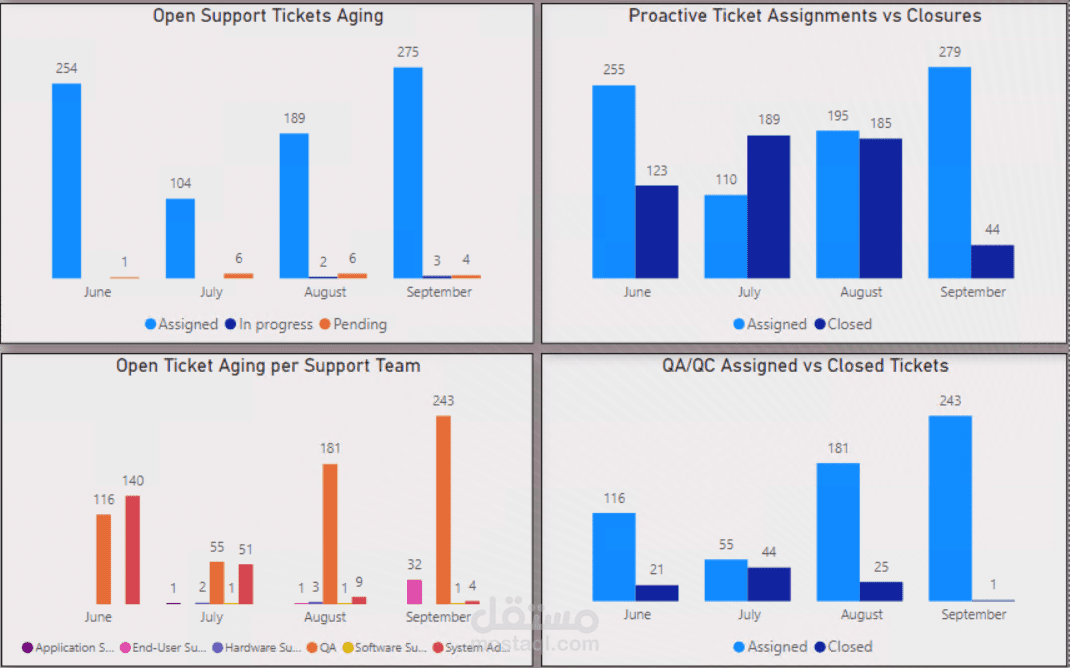
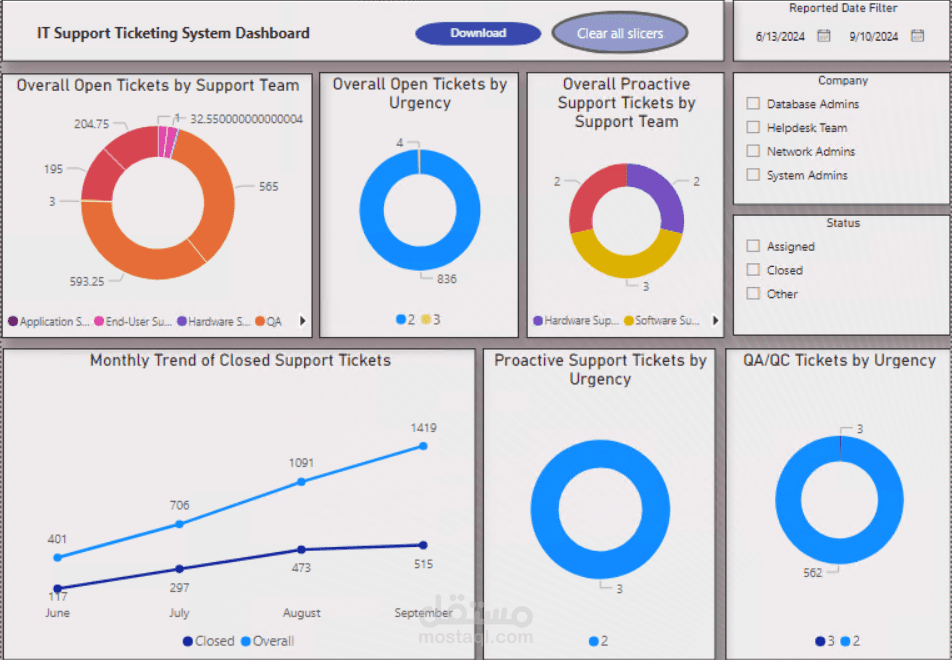
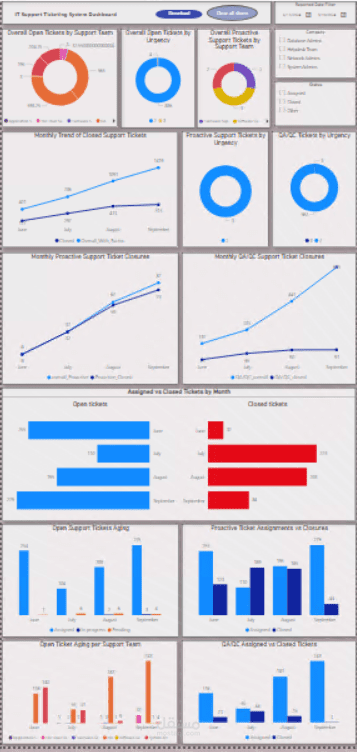
An interactive Power BI dashboard built to monitor and evaluate the performance of IT support teams by tracking open, closed, and aging tickets. It visualizes critical metrics such as ticket urgency, proactive support actions, and QA/QC trends to improve operational efficiency and service quality.
The dashboard includes donut, bar, and line charts to display team workloads, closure rates, and monthly performance trends, along with interactive slicers for filtering by team or ticket status. It empowers IT managers to identify bottlenecks, optimize resource allocation, and ensure timely, high-quality resolutions.
Tools: Power BI · DAX · Power Query