Analyze Super Store Sales
تفاصيل العمل
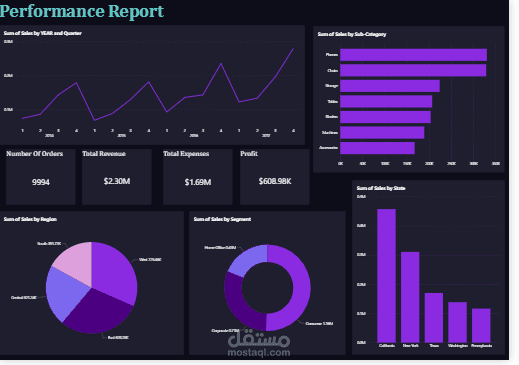
This dashboard provides a clear and interactive overview of business performance, designed to help decision-makers quickly understand sales trends, profitability, and key performance areas. It combines essential KPIs with visual insights to highlight which products, regions, and customer segments drive the most value.
Key Metrics:
Number of Orders: 9,994
Total Revenue: $2.30M
Total Expenses: $1.69M
Profit: $608.98K
Visual Insights:
A line chart tracks sales by year and quarter, showing steady growth over time.
A bar chart ranks sales by sub-category, with Phones generating the highest revenue.
A pie chart displays sales by region, showing the South and West as top performers.
A donut chart breaks down sales by customer segment, where Consumer holds the largest share.
A column chart compares sales by state, with California leading the results.