Excel Sales Analysis Dashboard
تفاصيل العمل
Key Features:
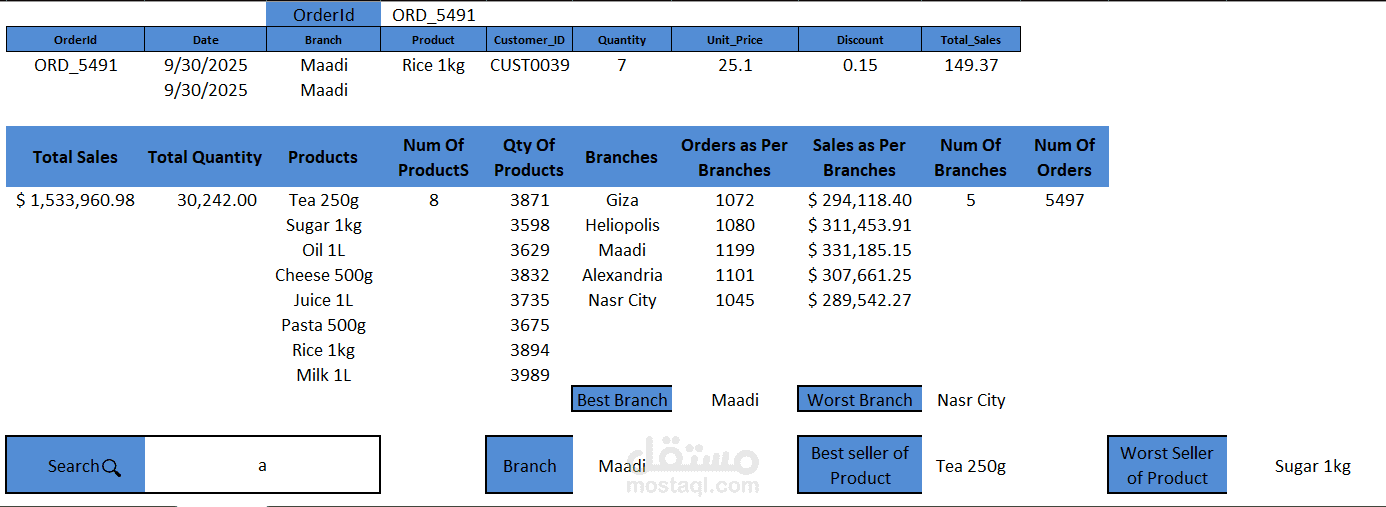
Displays Total Sales, Total Quantity, and Number of Orders.
Shows detailed performance per branch (Giza, Heliopolis, Maadi, Alexandria, Nasr City).
Highlights the Best Branch (Maadi) and Worst Branch (Nasr City) automatically.
Identifies the Best-Selling Product (Tea 250g) and Lowest-Selling Product (Sugar 1kg).
Includes a search bar to quickly filter data by product, branch, or order.
Calculates sales, quantity, and number of products dynamically using Excel formulas.
Tools Used:
Microsoft Excel (Formulas, Conditional Formatting, Dynamic Tables, and Dashboard Design)
Outcome:
An interactive Excel-based solution that provides quick insights into sales data, enabling decision-makers to track performance, identify weak areas, and optimize sales strategy.