Sales Performance Dashboard
تفاصيل العمل
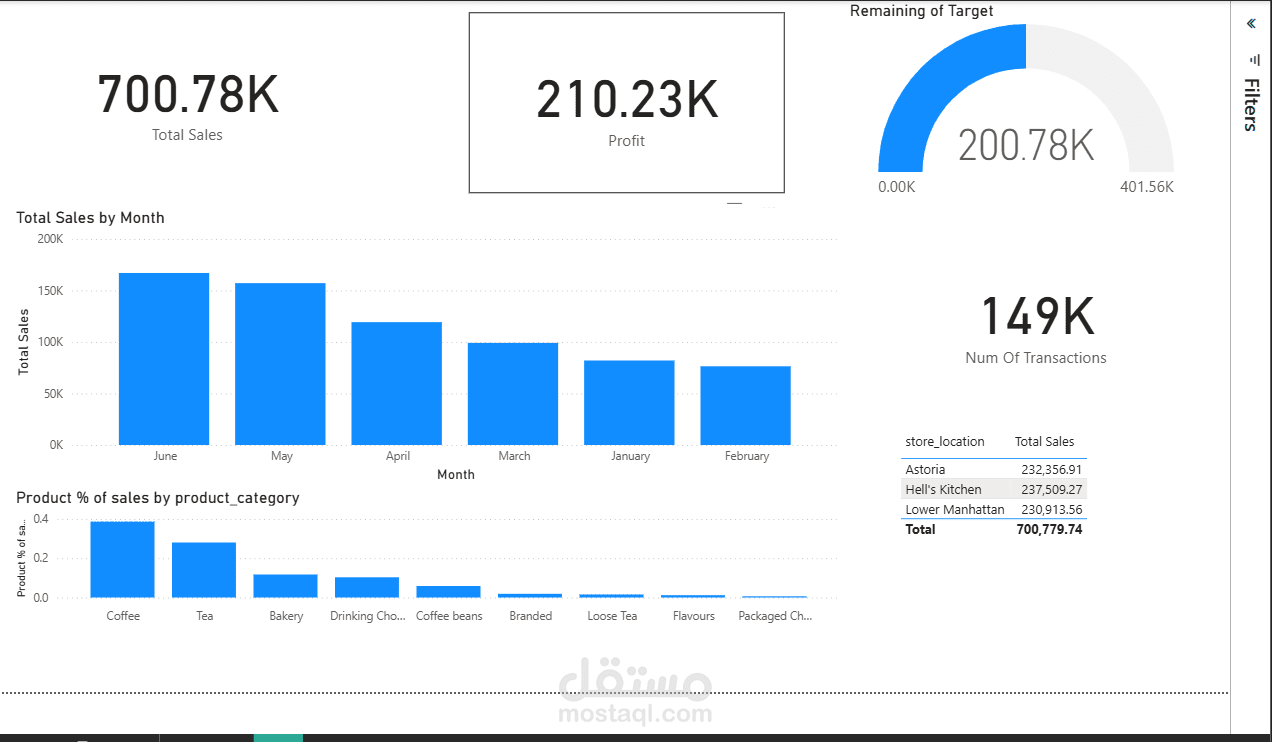
This Power BI dashboard provides a clear overview of total sales, profit, and transactions across multiple store locations.
It helps management monitor business performance, compare sales trends over months, and identify top-performing products.
Key Insights:
Total Sales: 700.78K
Total Profit: 210.23K
Number of Transactions: 149K
Top Sales Months: June and May
Top Selling Products: Coffee and Tea
Store Performance: Astoria and Hell’s Kitchen lead in total sales.
Target Tracking: Gauge chart displays remaining progress toward the sales target.
Tools Used:
Power BI
Excel (for data preprocessing and cleaning)
Outcome:
An interactive, data-driven dashboard that allows users to quickly analyze performance by month, product category, and store location, supporting smarter and faster business decisions.