Sales Dashboard
تفاصيل العمل
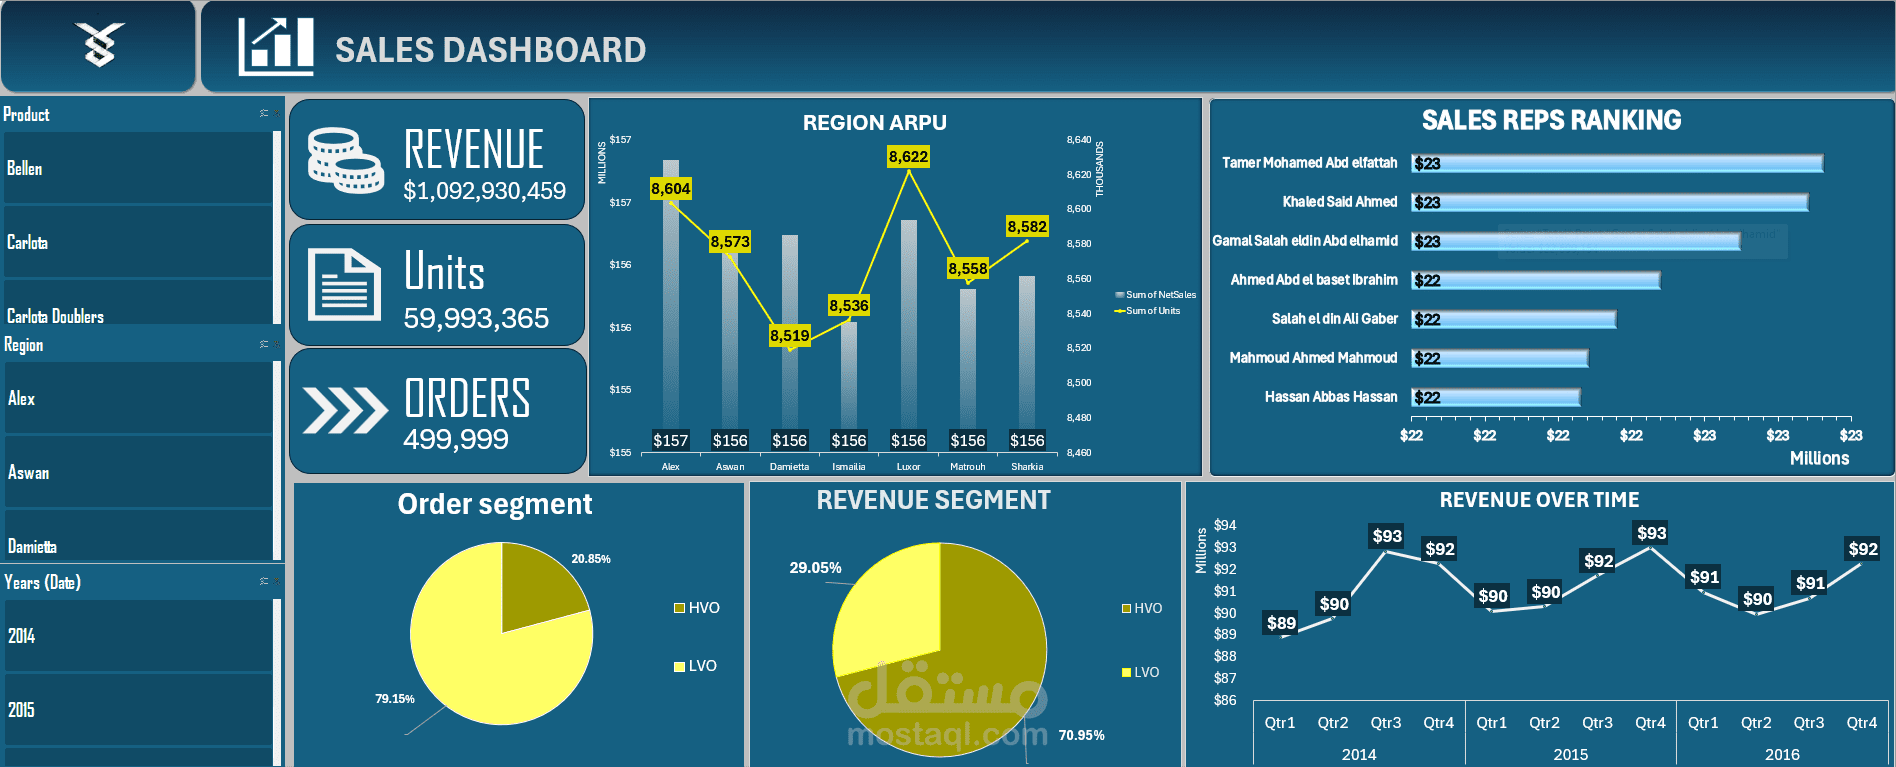
urning 500K Rows Into Insights
I recently developed an interactive Sales Dashboard in Excel to analyze a dataset of around 500,000 rows.
To manage this volume, I used Power Pivot with DAX for calculations and modeling.
The dashboard provides:
● Overall revenue, units, and orders
● Regional ARPU (Average Revenue Per Unit) analysis
● Sales representatives’ performance ranking
● Segmented views of orders and revenue
● Revenue trends over time
The objective was to transform raw sales data into actionable insights and build a reporting tool that is both interactive and efficient.
As a data analyst, I focus on creating solutions that help businesses see the story behind their numbers.