Revenue and margin analysis
تفاصيل العمل
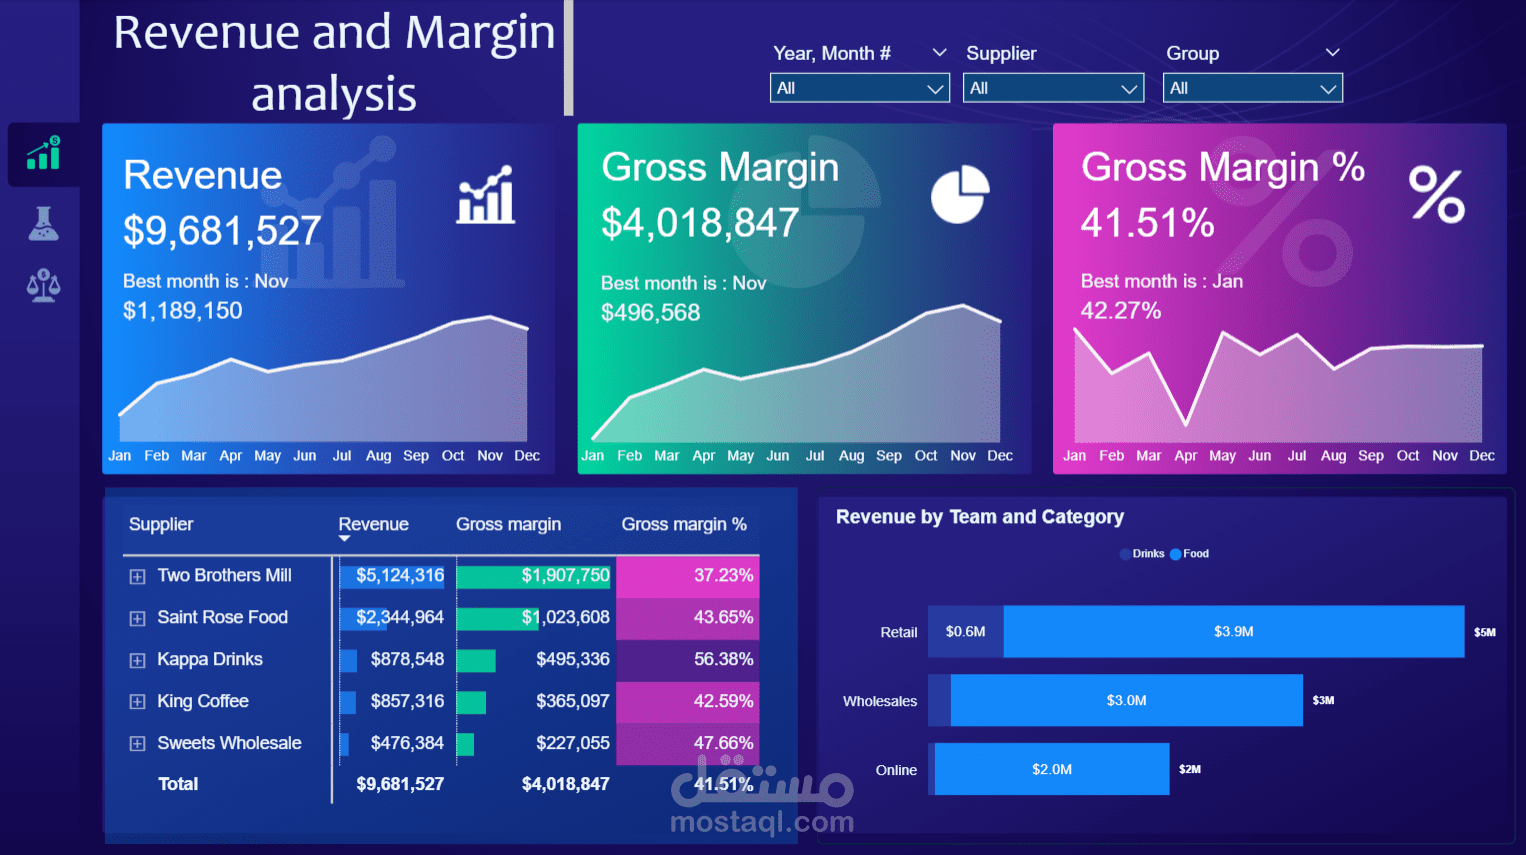
I dove into a massive dataset of 150,000 rows to uncover key insights into our business performance. The results? Total revenue hit $9,681,527, with a solid gross margin of $4,018,847 (that's 41.51%!). November stood out as the peak month for both revenue ($1,189,150) and gross margin ($496,568), while January led in margin percentage at 42.27%.
Breaking it down by suppliers:
· Two Brothers Mill: $5,124,316 revenue, 37.23% margin
· Saint Rose Food: $2,344,964 revenue, 43.65% margin
· Kappa Drinks: $878,548 revenue, 56.38% margin
· King Coffee: $857,316 revenue, 42.5% margin
· Sweets Wholesale: $476,384 revenue, 47.66% margin
On the team and category side, Retail dominated with $3.9M in Food and $0.6M in Drinks, followed by Wholesale at $3.0M and Online at $2.0M. These visuals highlight trends over the year, showing steady growth with some seasonal peaks perfect for strategic decision-making!
How I Built It (Simplified):
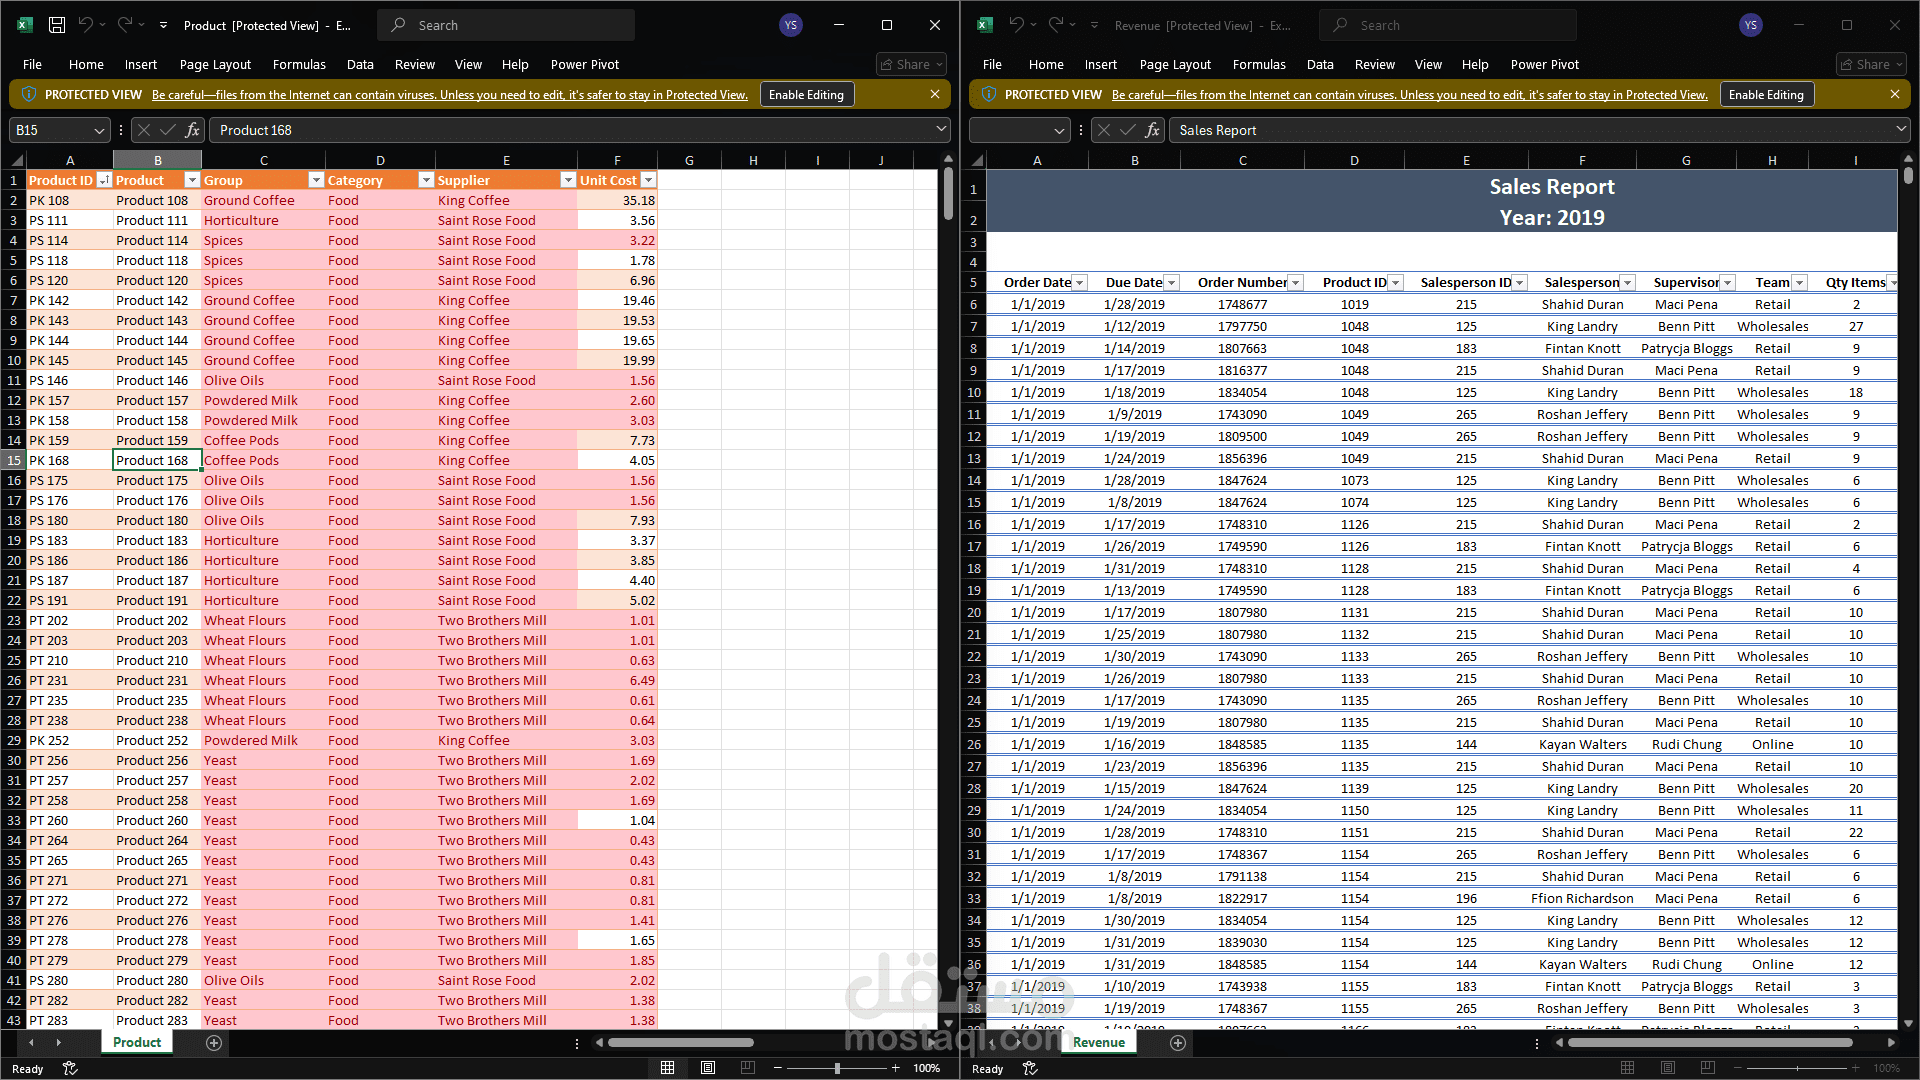
1. Data Prep in Power Query: Started with raw data import, then handled preprocessing and cleaning. A key step was normalizing the data to ensure consistency (e.g., standardizing formats for dates, currencies, and categories). This eliminated duplicates, filled missing values, and transformed columns for better analysis—all without complex coding.
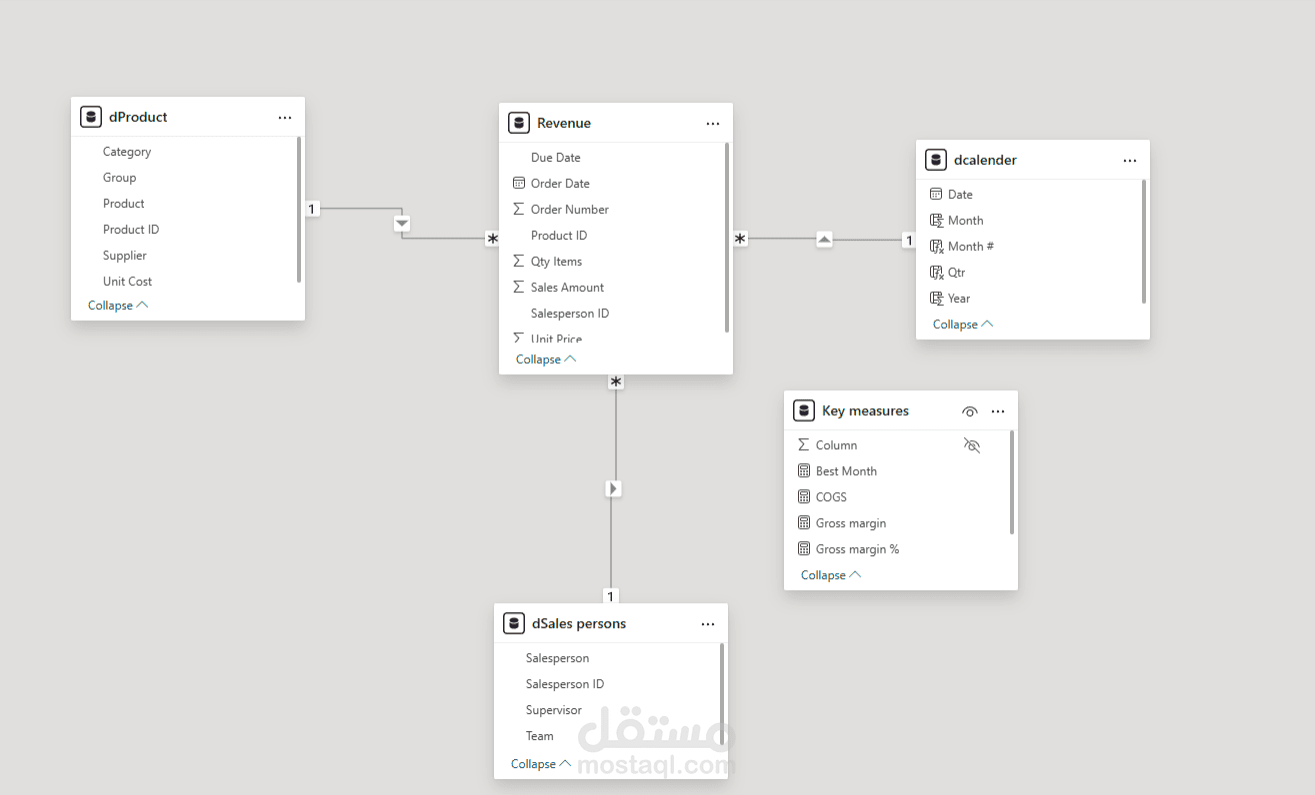
2. Data Modeling: In Power BI, I created relationships between tables (e.g., linking sales transactions to supplier and category tables via common keys like Supplier ID and Category ID). This star schema setup allowed seamless slicing and dicing of data.
3. Dashboard Creation: Used Power BI's intuitive interface to build interactive visuals, including line charts for monthly trends and bar charts for breakdowns.
Key Measures and KPIs Explained:
· Revenue: Sum of all sales amounts straightforward aggregation to track total income.
· Gross Margin: Calculated as Revenue minus Cost of Goods Sold (COGS), showing pure profit before overheads.
· Gross Margin %: (Gross Margin / Revenue) * 100 a critical KPI for efficiency, highlighting how much profit we retain from each dollar earned.
· Other KPIs like "Best Month" use TOPN functions in DAX to identify peaks, making it easy to spot high performers.