تحليل بيانات للعقارات
تفاصيل العمل
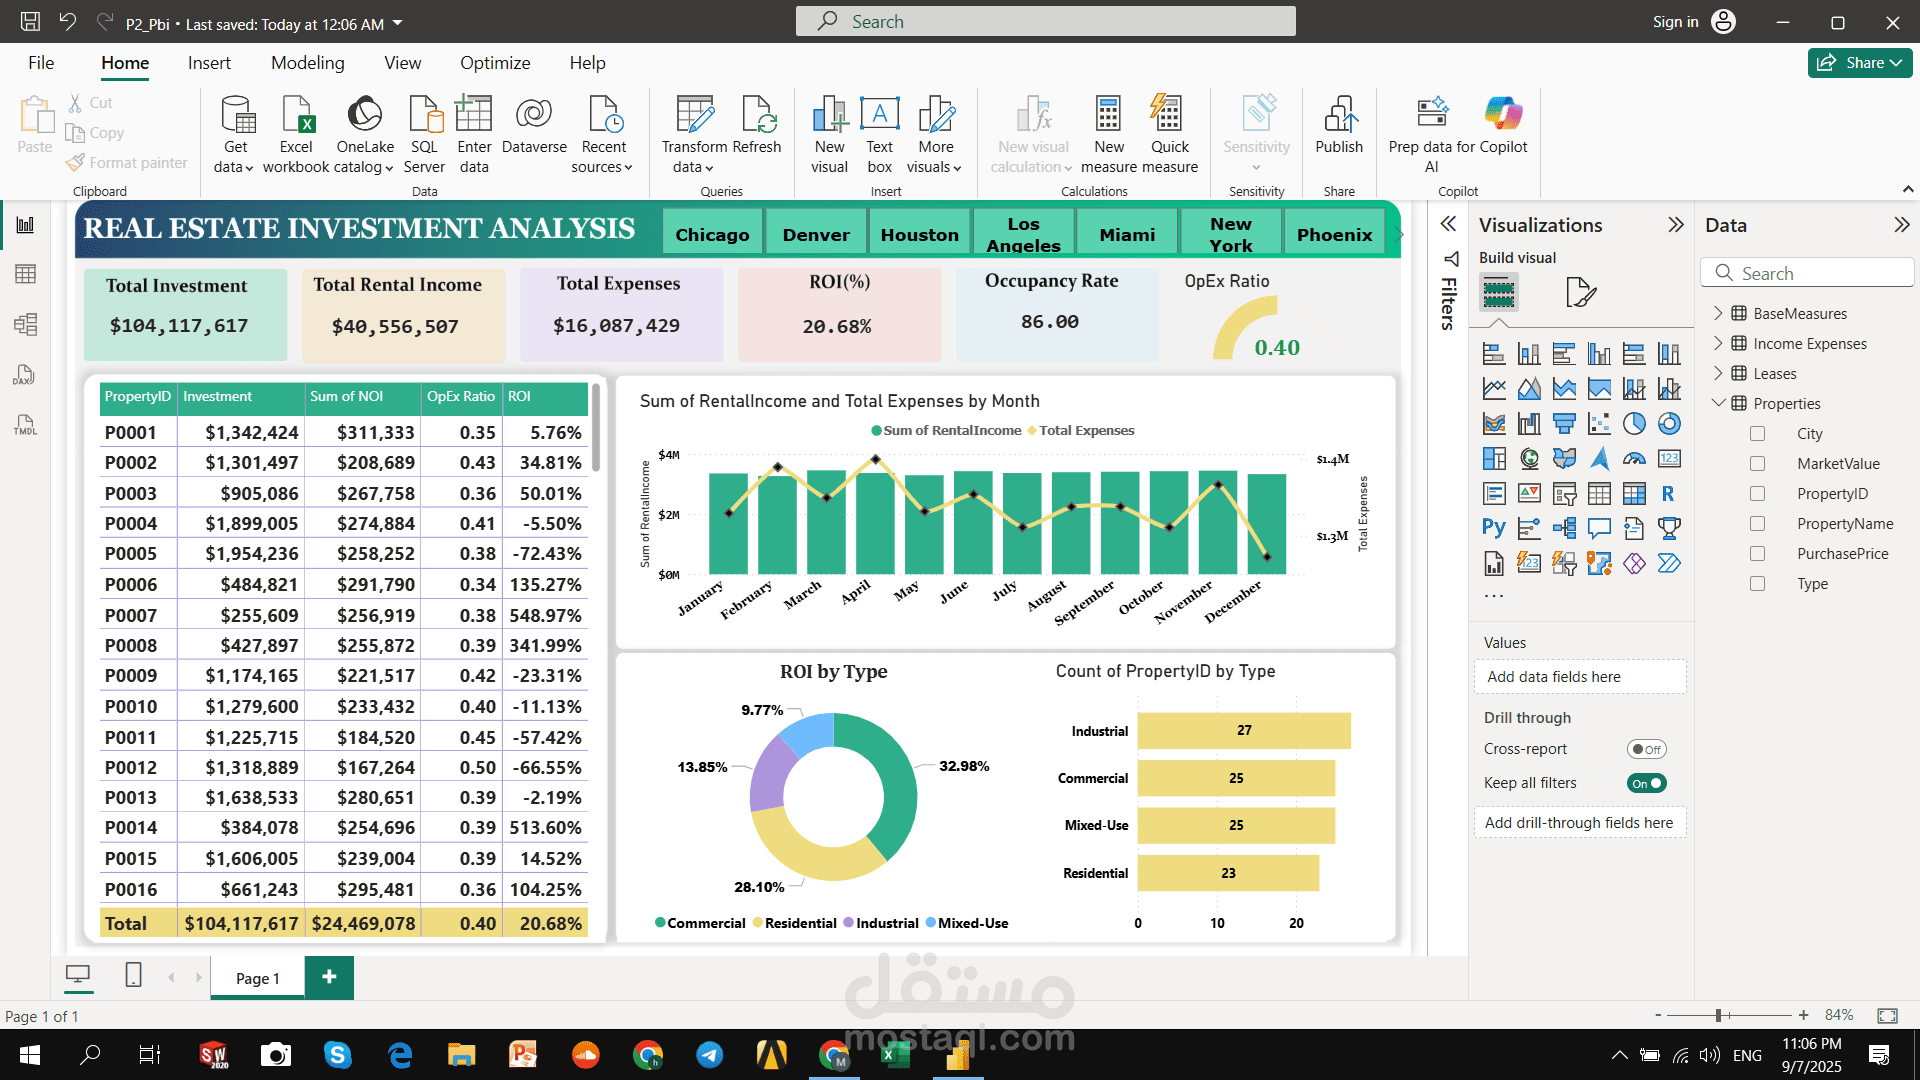
Project Overview:
This project focuses on analyzing real estate data to understand property market trends, pricing behavior, and investment opportunities. The dataset contains detailed information about properties, including their type, location, price, and area. The goal is to identify factors affecting property prices, highlight high-demand areas, and visualize market performance across regions.
Dataset Description:
Data Source: Simulated real estate listings (2023–2024)
Number of Records: ~5,000 property listings
Main Fields:
Property ID – Unique identifier for each property
Property Type – Apartment, Villa, Land, Office, etc.
City – City or district where the property is located
Area (sqm) – Property size in square meters
Bedrooms – Number of bedrooms
Bathrooms – Number of bathrooms
Price – Listing or selling price
Price per sqm – Calculated metric (Price ÷ Area)
Agent – Listing agent or agency name
Listing Date – Date when the property was listed
? Analysis Goals:
Identify factors influencing property prices (location, size, type)
Analyze average prices by city and property type
Detect high-demand areas and investment hotspots
Visualize property price distribution
Create an interactive dashboard to support real estate decision-making
️ Tools Used:
Excel / Power BI / Python (Pandas, Matplotlib, Seaborn)
Data Cleaning, Correlation Analysis, and Visualization
Deliverables:
Cleaned and well-documented dataset
Power BI / Excel dashboard with filters for city, property type, and price range
Summary report with key insights and recommendations
نظرة عامة على المشروع:
يهدف هذا المشروع إلى تحليل بيانات العقارات لفهم اتجاهات السوق العقاري وسلوك الأسعار وفرص الاستثمار. يحتوي ملف البيانات على تفاصيل العقارات مثل نوعها، وموقعها، ومساحتها، وسعرها. الهدف هو تحديد العوامل المؤثرة في الأسعار، واكتشاف المناطق ذات الطلب المرتفع، وعرض أداء السوق من خلال لوحات تفاعلية.
وصف البيانات:
مصدر البيانات: بيانات عقارات افتراضية (2023–2024)
عدد السجلات: حوالي 5,000 عقار
الحقول الأساسية:
Property ID – رقم تعريف فريد لكل عقار
Property Type – نوع العقار (شقة، فيلا، أرض، مكتب، إلخ)
City – المدينة أو المنطقة
Area (sqm) – المساحة بالمتر المربع
Bedrooms – عدد غرف النوم
Bathrooms – عدد الحمامات
Price – سعر البيع أو العرض
Price per sqm – السعر لكل متر مربع (محسوب)
Agent – اسم الوكيل أو شركة التسويق
Listing Date – تاريخ إدراج العقار
? أهداف التحليل:
تحديد العوامل المؤثرة في أسعار العقارات
تحليل متوسط الأسعار حسب المدينة ونوع العقار
اكتشاف المناطق الأعلى طلبًا والأكثر ربحية
عرض توزيع الأسعار في السوق
إنشاء لوحة تحكم تفاعلية لدعم قرارات الاستثمار
️ الأدوات المستخدمة:
Excel / Power BI / Python (Pandas, Matplotlib, Seaborn)
تنظيف البيانات، تحليل الارتباطات، وتمثيل البيانات بصريًا
المخرجات النهائية:
ملف بيانات منظم وجاهز للتحليل
لوحة تحكم تفاعلية بفلاتر متعددة (المدينة، نوع العقار، السعر)
تقرير بالرؤى والنتائج الرئيسية حول اتجاهات السوق