Data Entry & Financial Analysis & Dashboard for a Furniture Company
تفاصيل العمل

Project Title: Financial Analysis & Dashboard for a Furniture Company
Project Overview:
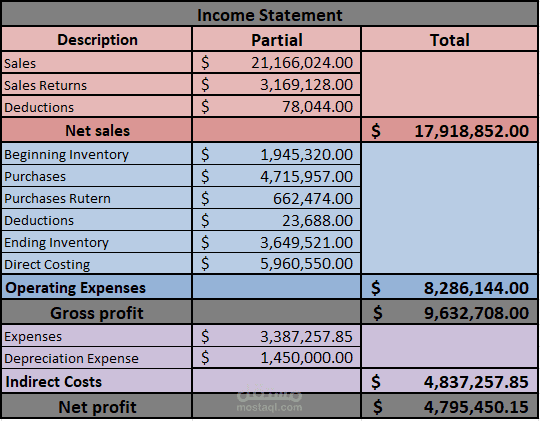
I developed a comprehensive financial analysis dashboard for a furniture company to track and visualize its key financial operations — including purchases, sales, and administrative expenses — using Microsoft Excel.
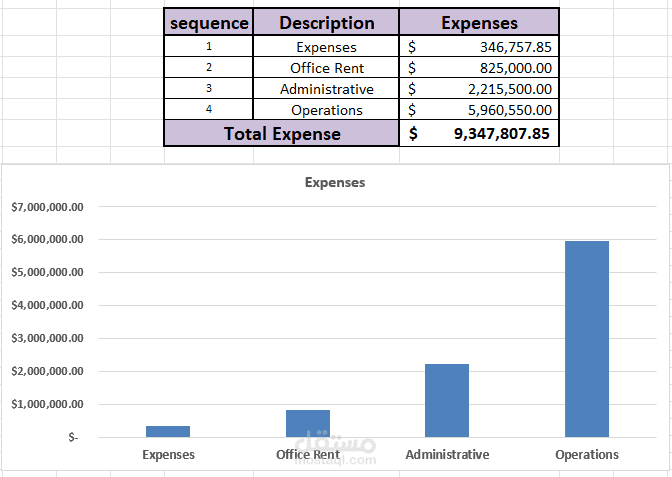
The project integrates dynamic formulas, automated calculations, and visual analytics through interactive charts. Each section (Purchases, Sales, and Expenses) was built to provide clear insights into company performance, helping management make accurate and data-driven decisions.
Key Features:
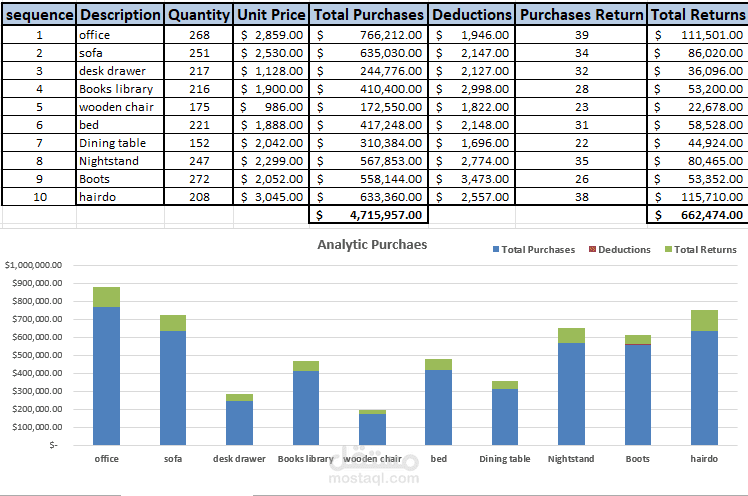
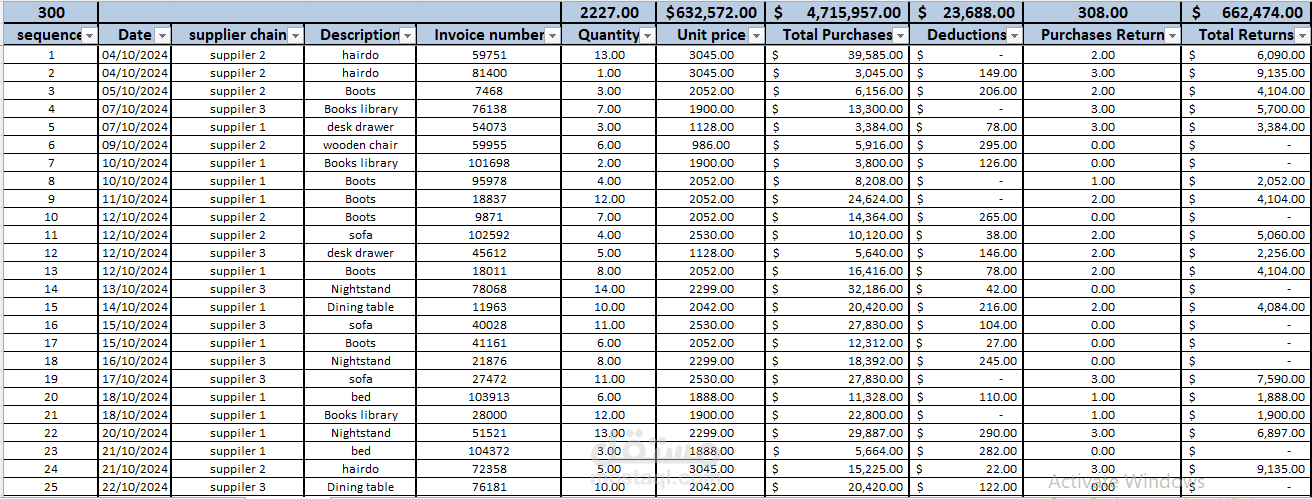
Analytic Purchases Dashboard: Displays total purchases, deductions, and return rates for each product category with a visual bar chart.
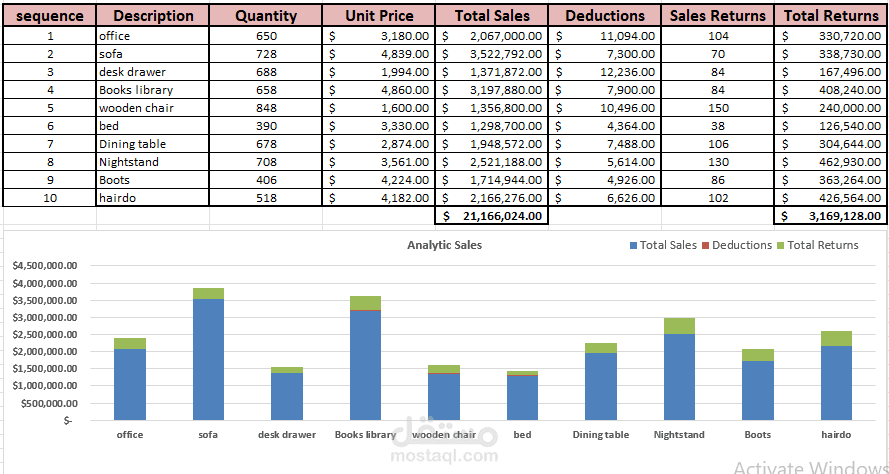
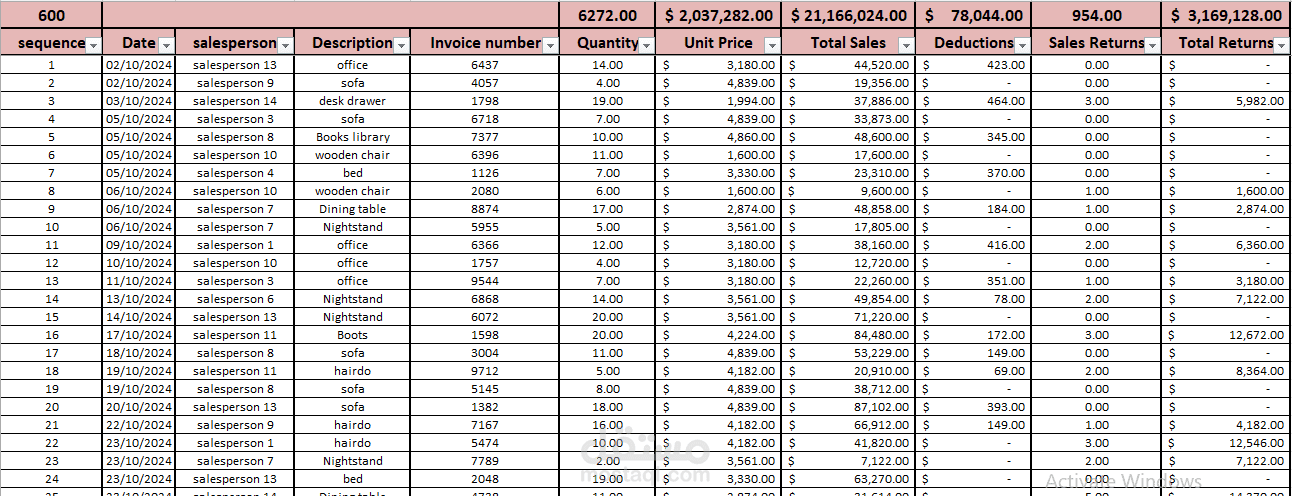
Analytic Sales Dashboard: Tracks total sales, deductions, and sales returns to measure profitability trends.
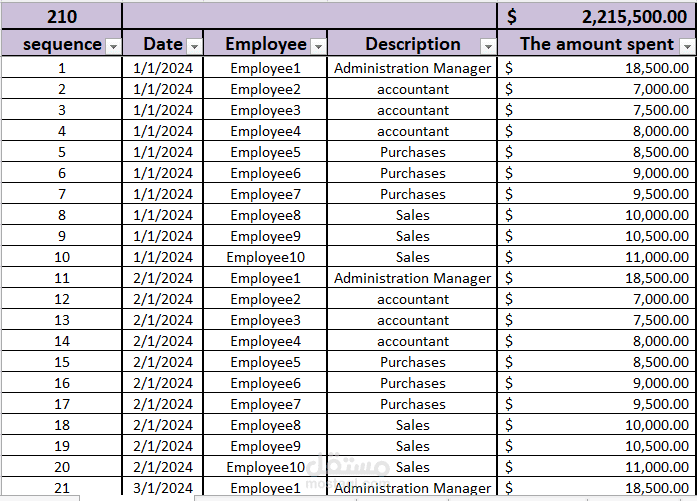
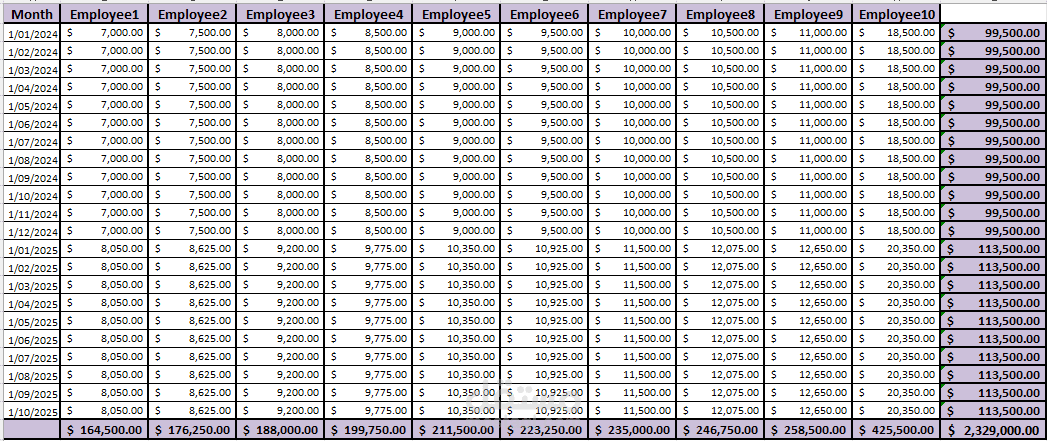
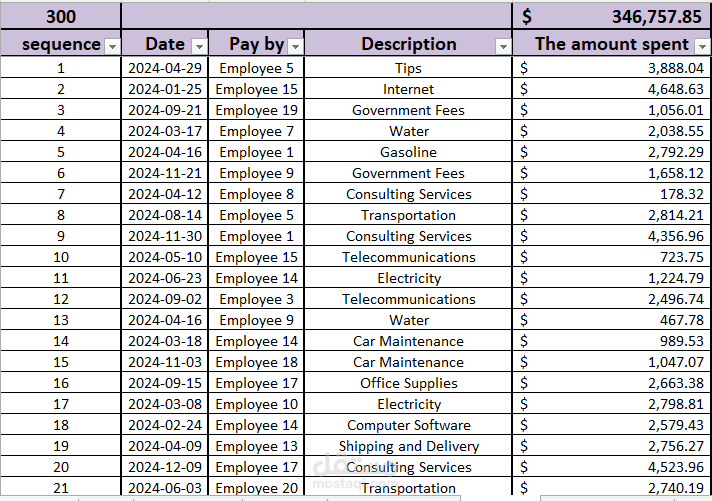
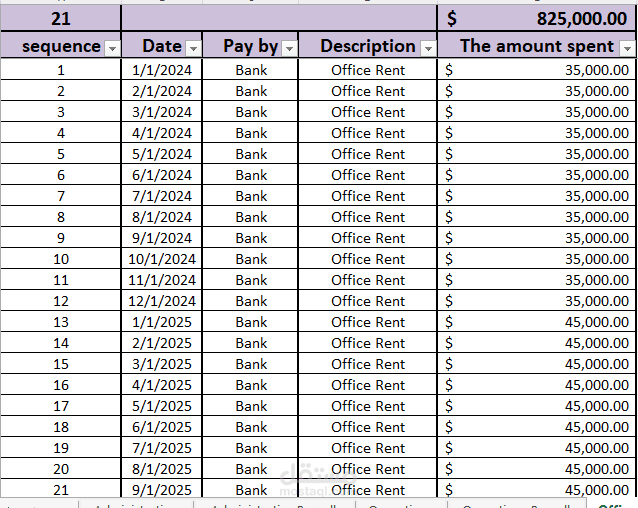
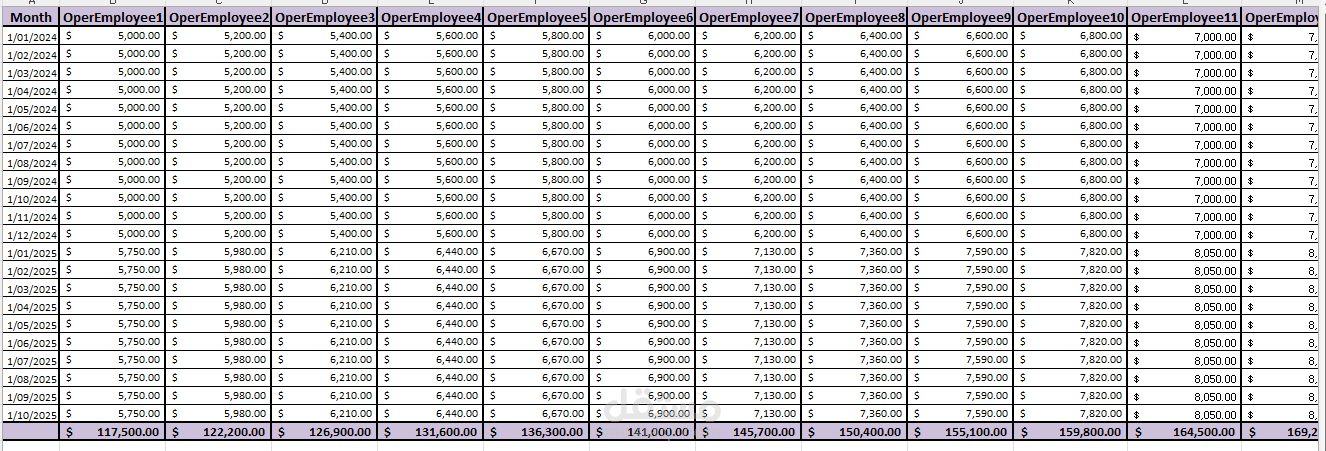
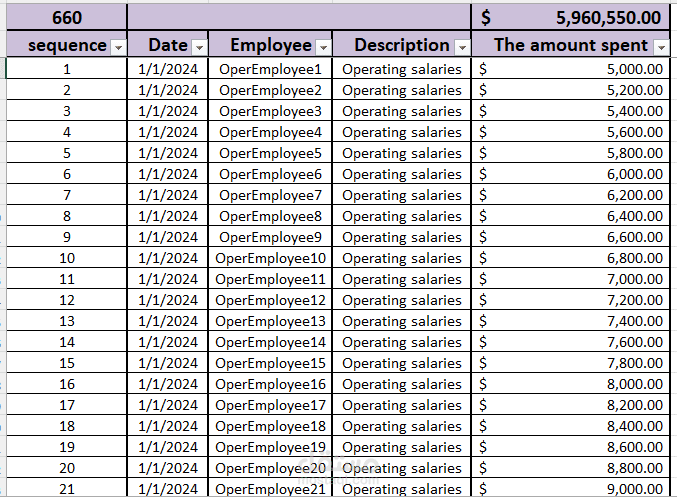
Expense Tracking Sheet: A structured log of all administrative and operational expenses, categorized by employee and type of spending.
Automated Calculations: All formulas were built to automatically update totals and visual charts when new data is added.
Clean, Professional Design: Consistent formatting, color coding, and currency alignment for easy data interpretation.
Tools & Skills Used:
Microsoft Excel (advanced formulas, pivot charts, and formatting)
Financial Analysis & Reporting
Data Visualization & Dashboard Creation
Business Performance Analysis
Impact:
This dashboard significantly improved financial transparency and decision-making for the company. It allowed management to identify trends in sales and expenses instantly and optimize operations accordingly.