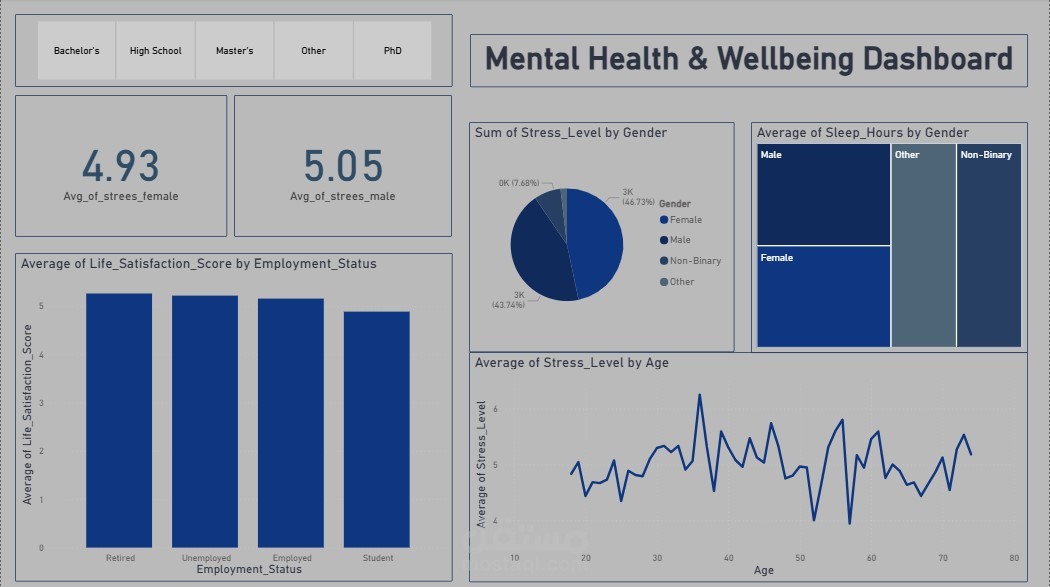
Mental Health & Wellbeing Data Insights
تفاصيل العمل

Type of Work:
Data Analysis and Visualization using Power BI
Project Overview:
A dashboard designed to analyze mental health and wellbeing indicators such as stress, sleep hours, and life satisfaction across various demographic groups.
Key Features:
Clear visualization of stress and satisfaction levels.
Comparison between gender, employment, and age groups.
Interactive filters for deeper insights.
Clean, user-friendly design focused on data clarity.
Execution Process:
Data Collection: Used open survey datasets related to wellbeing.
Data Cleaning: Processed and standardized responses using Excel and Power Query.
Data Modeling: Created structured relationships for demographics and responses.
Visualization: Built interactive charts with DAX measures in Power BI.
Result: Delivered a dashboard that identifies key wellbeing patterns across society.