Full Data Analysis Project | Power BI
تفاصيل العمل

Excited to share that I’ve completed a full end-to-end Data Analysis project and delivered a professional interactive dashboard
Here’s what I did, step by step:
? Data cleaning & preparation with Power Query (standardization, missing value handling, ETL).
Built a robust Data Model to correctly relate tables for reliable calculations.
? Created advanced Measures & calculations using DAX — many custom measures to support accurate KPIs.
Designed the dashboard background & mockups in Figma for a polished UI/UX.
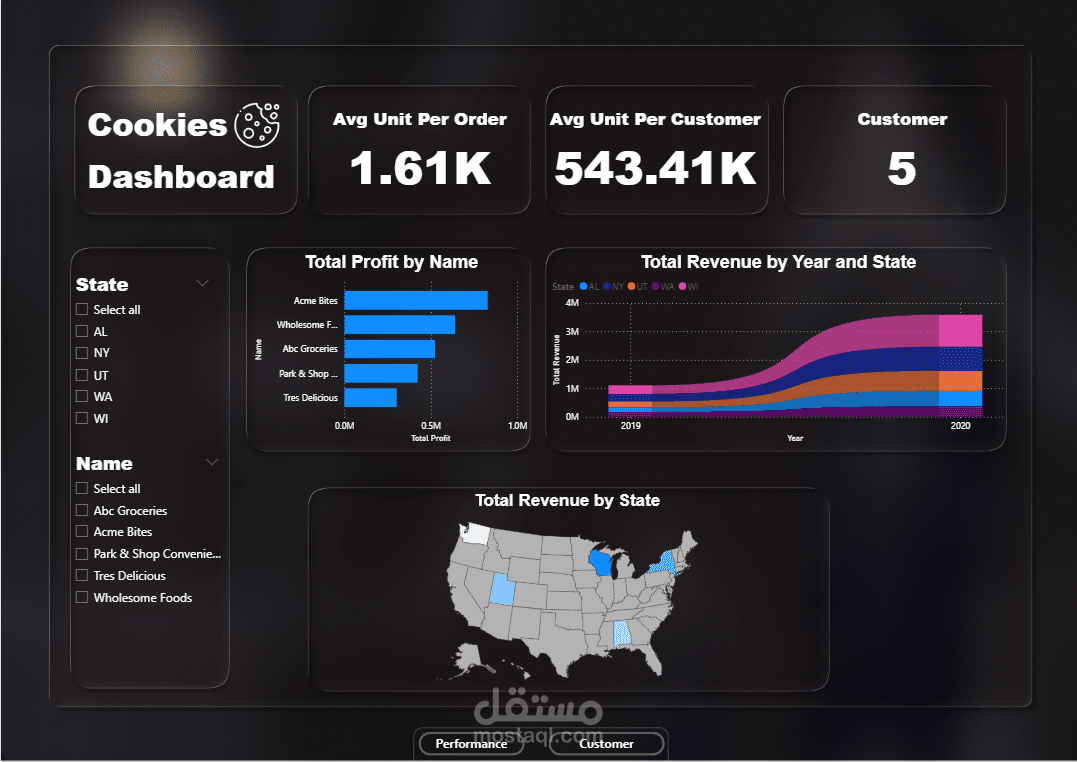
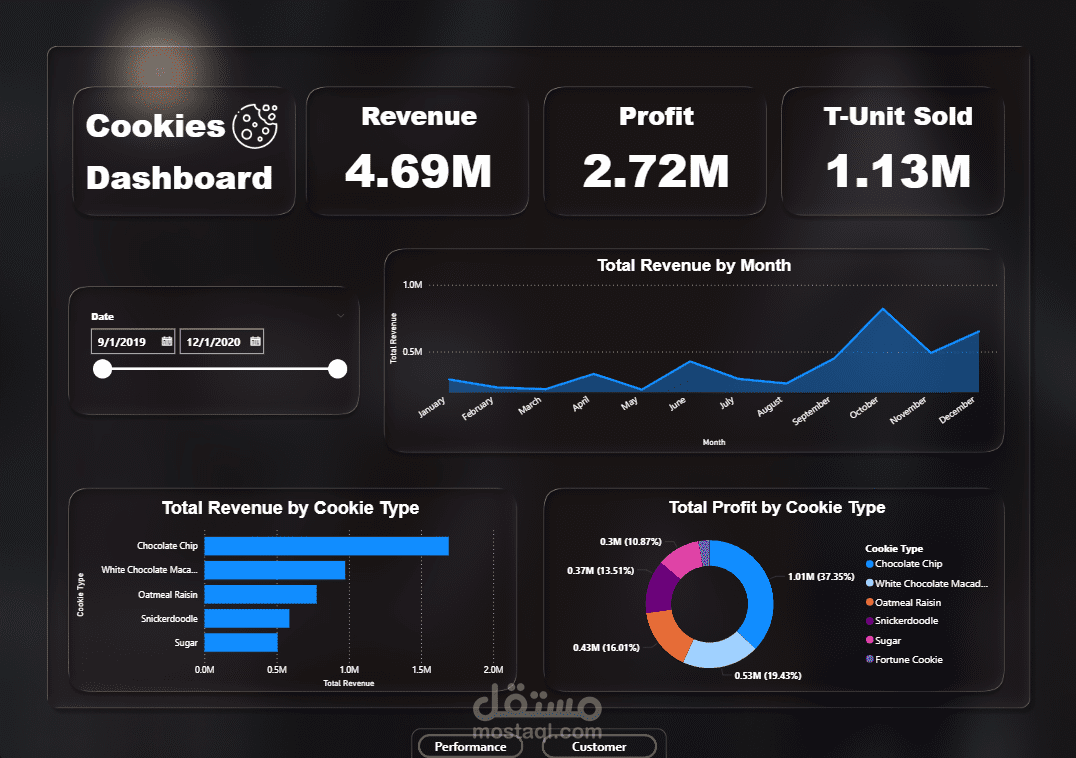
Built interactive visualizations in Power BI (KPIs, maps, time series, bar & donut charts, metric cards) and added navigation buttons between pages.
Assembled everything into an interactive decision-ready dashboard for business users.
Outcome: One consolidated dashboard that delivers clear KPIs (Revenue, Profit, Units, Top Customers/Products) with interactive controls to explore insights quickly.