Full Data Analysis Project | Power BI
تفاصيل العمل
Full Data Analysis Project | Power BI
Excited to share a new end-to-end Data Analysis project I completed using Power BI — from raw data cleanup to an interactive, decision-ready dashboard.
What I delivered:
? Data cleaning & preparation using Power Query (standardization, missing value handling, ETL).
Robust Data Modeling to correctly relate tables and enable reliable calculations.
? Advanced Measures & calculations built with DAX (many custom measures to meet business KPIs).
Interactive visualizations and a user-friendly dashboard for stakeholders.
Figma used to design a polished dashboard background and enhance UX/UI.
Key outcomes:
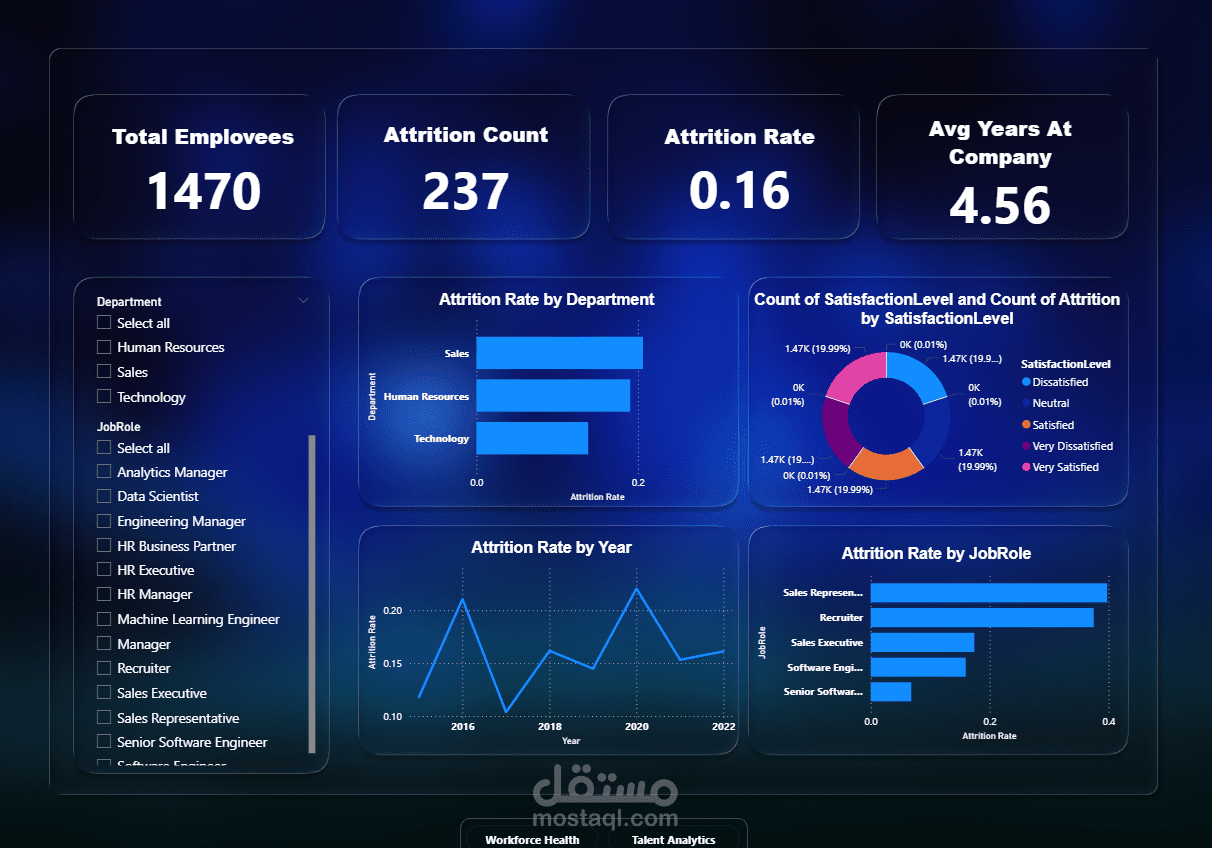
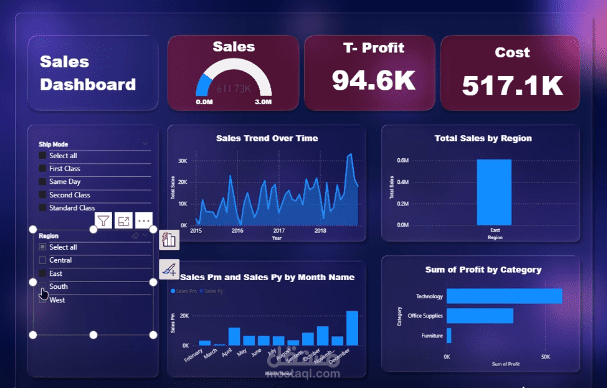
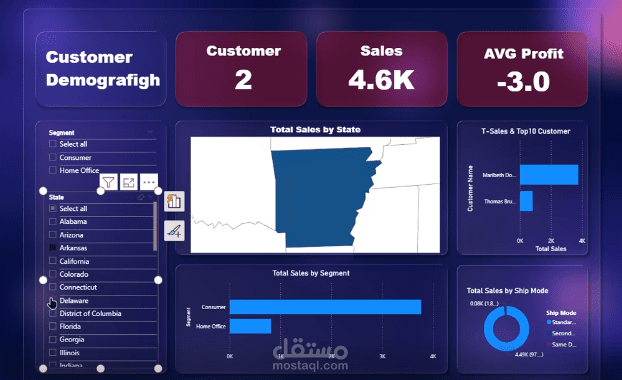
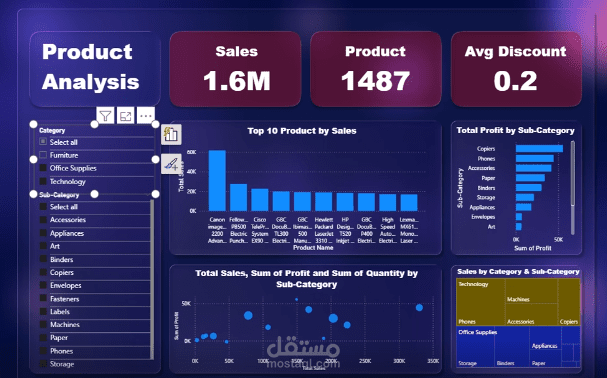
A single interactive dashboard presenting clear KPIs (Sales, Profit, Quantity, Top Customers, Top Products) with slicers and a timeline for fast filtering.
Consolidated messy datasets into a trustworthy analytics source.
Actionable insights that enable faster, data-driven decisions.
Why it matters: Clean data + strong modeling = trusted insights. A dashboard is no longer a static report — it’s a decision tool.