Data Cleaning , preprocessing ,integration and analysis project using Excel and power Query
تفاصيل العمل
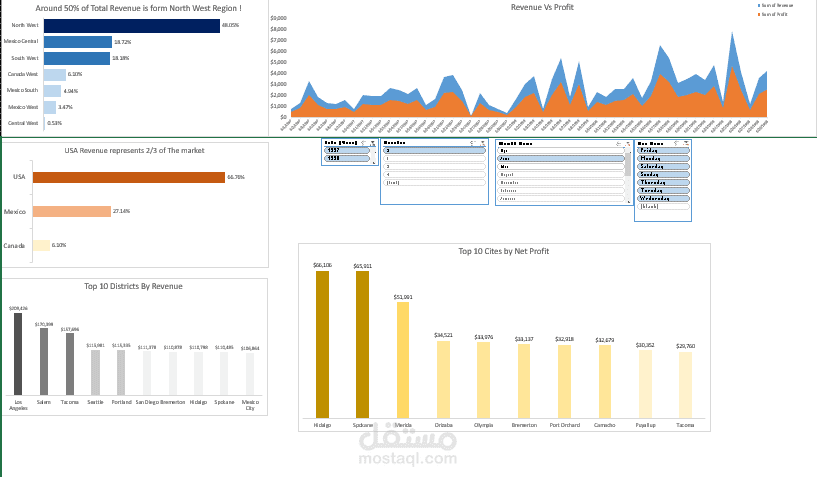
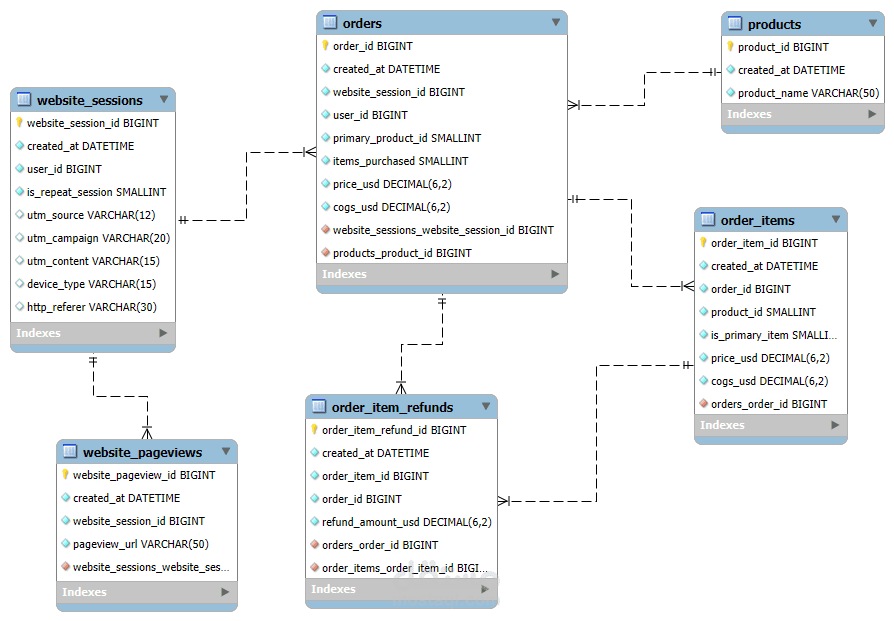

I created an interactive Excel dashboard to analyze performance across multiple retail stores. Starting with raw CSV files, I used Power Query for data cleaning and preprocessing — handling missing values, unifying formats, and preparing datasets for analysis. The cleaned data was then visualized through dynamic Excel dashboards, highlighting key insights such as sales performance, profit trends, regional comparisons, and top-performing products. This project provided a clear view of global store operations and supported data-driven business decisions.