Sales Tracker Dashboard with Power BI
تفاصيل العمل
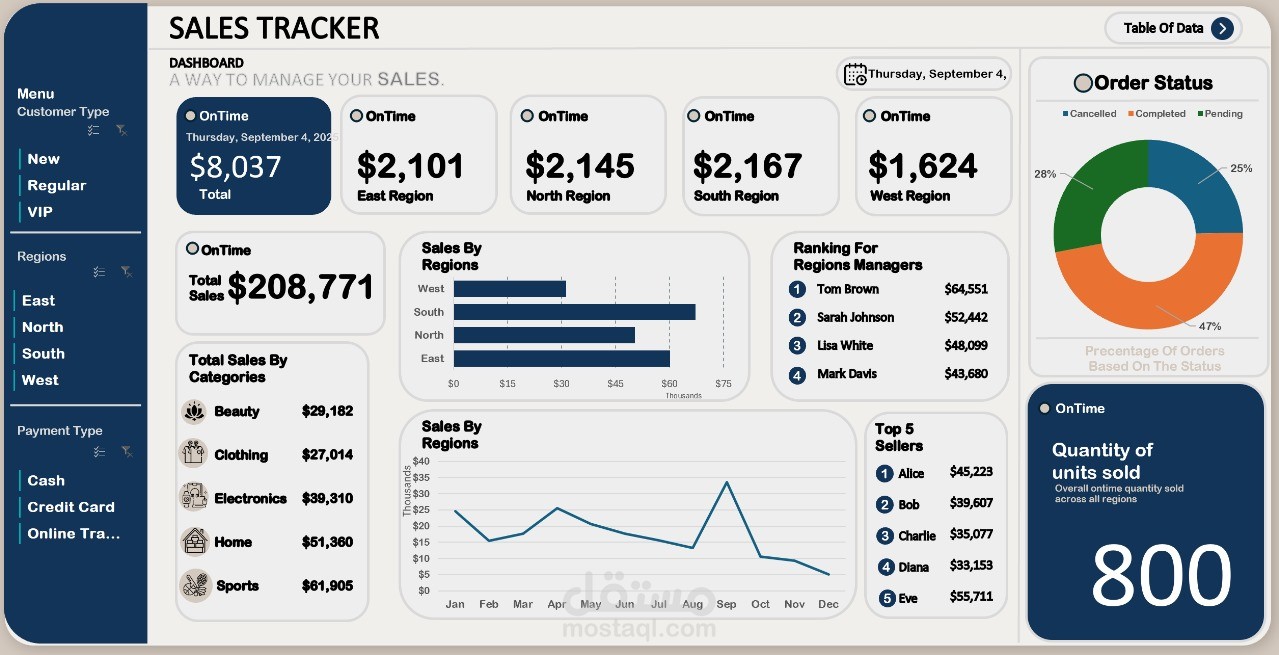
قمت بتصميم لوحة تحكم تفاعلية لمتابعة وتحليل المبيعات باستخدام Power BI، بهدف مساعدة الإدارة على تتبع الأداء وتحسين القرارات التسويقية.
الداشبورد بتعرض بيانات تفصيلية عن إجمالي المبيعات، الأرباح، أداء مندوبي البيع، المنتجات الأكثر مبيعًا، والمناطق ذات الأداء الأعلى.
استخدمت Power Query لتنظيف وتجهيز البيانات، وDAX لحساب المؤشرات الرئيسية مثل نسبة النمو، متوسط قيمة الطلب، وهامش الربح.
النتيجة كانت لوحة جذابة وسهلة الاستخدام بتوفر نظرة شاملة وفورية عن وضع المبيعات، وتساعد في اكتشاف الاتجاهات والفرص بسرعة.
==================================
I created an interactive Sales Tracker Dashboard using Power BI to help management monitor performance and make data-driven marketing decisions.
The dashboard provides detailed insights into total sales, profit margins, top-selling products, best-performing regions, and individual sales representatives.
I used Power Query for data cleaning and transformation, and DAX to calculate key metrics such as growth rate, average order value, and profit margin.
The result is a visually appealing, easy-to-navigate dashboard that offers a complete overview of sales performance and helps identify trends and opportunities.