call center dashboard with power bi
تفاصيل العمل
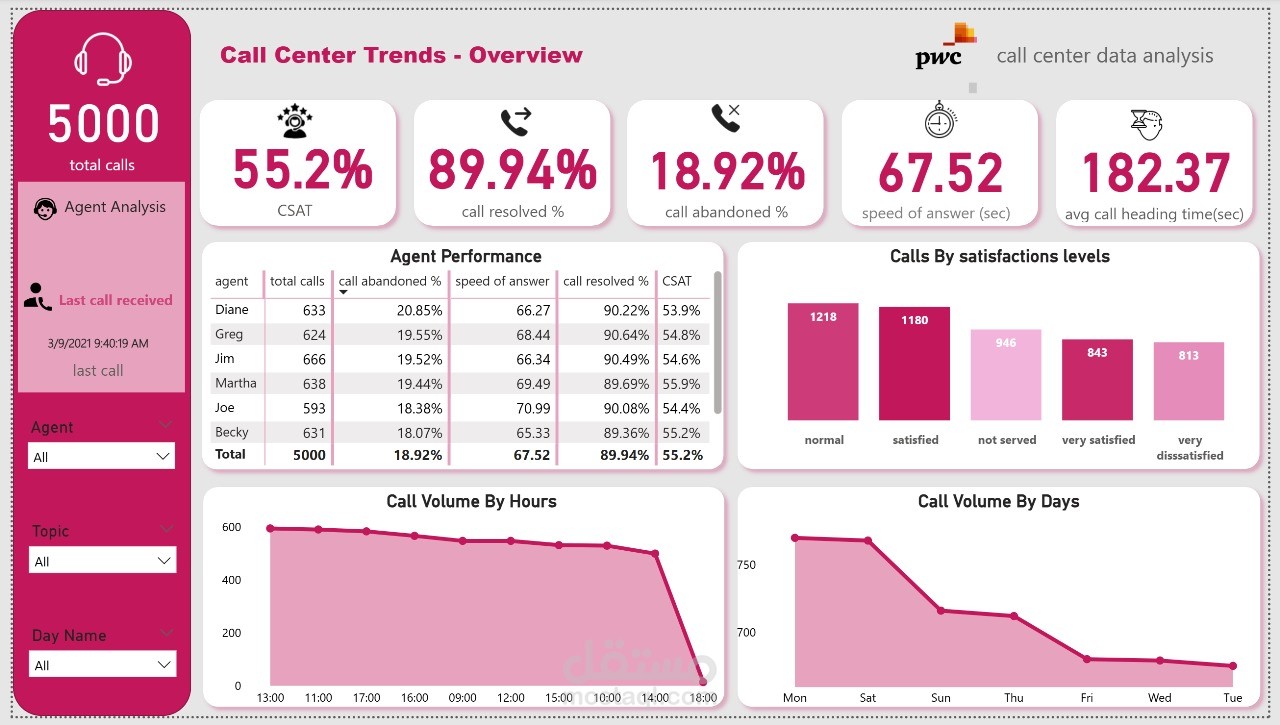
قمت بتصميم لوحة تحكم تفاعلية لمركز اتصال (Call Center) باستخدام Power BI بهدف تحليل أداء الموظفين وتتبع مؤشرات الخدمة بشكل لحظي.
الداشبورد بتعرض بيانات شاملة عن المكالمات الواردة والصادرة، مدة الانتظار، معدلات الرد، رضا العملاء، وأداء كل وكيل بشكل منفصل.
استخدمت أدوات DAX وPower Query لتنظيف البيانات وتحسينها قبل عرضها بشكل بصري واضح وسهل الفهم.
النتيجة كانت لوحة تفاعلية تساعد الإدارة في متابعة الأداء اليومي، تحديد نقاط الضعف، واتخاذ قرارات أسرع لتحسين جودة الخدمة.
=============================================
I designed an interactive Call Center Dashboard using Power BI to analyze agent performance and track key service metrics in real time.
The dashboard displays comprehensive data on incoming and outgoing calls, average wait time, response rates, customer satisfaction, and individual agent performance.
Using DAX and Power Query, I cleaned and optimized the data to ensure accurate and meaningful insights.
The result is a dynamic dashboard that helps management monitor daily operations, identify issues, and make data-driven decisions to enhance service quality.