Breaking Bad Dashboard
تفاصيل العمل
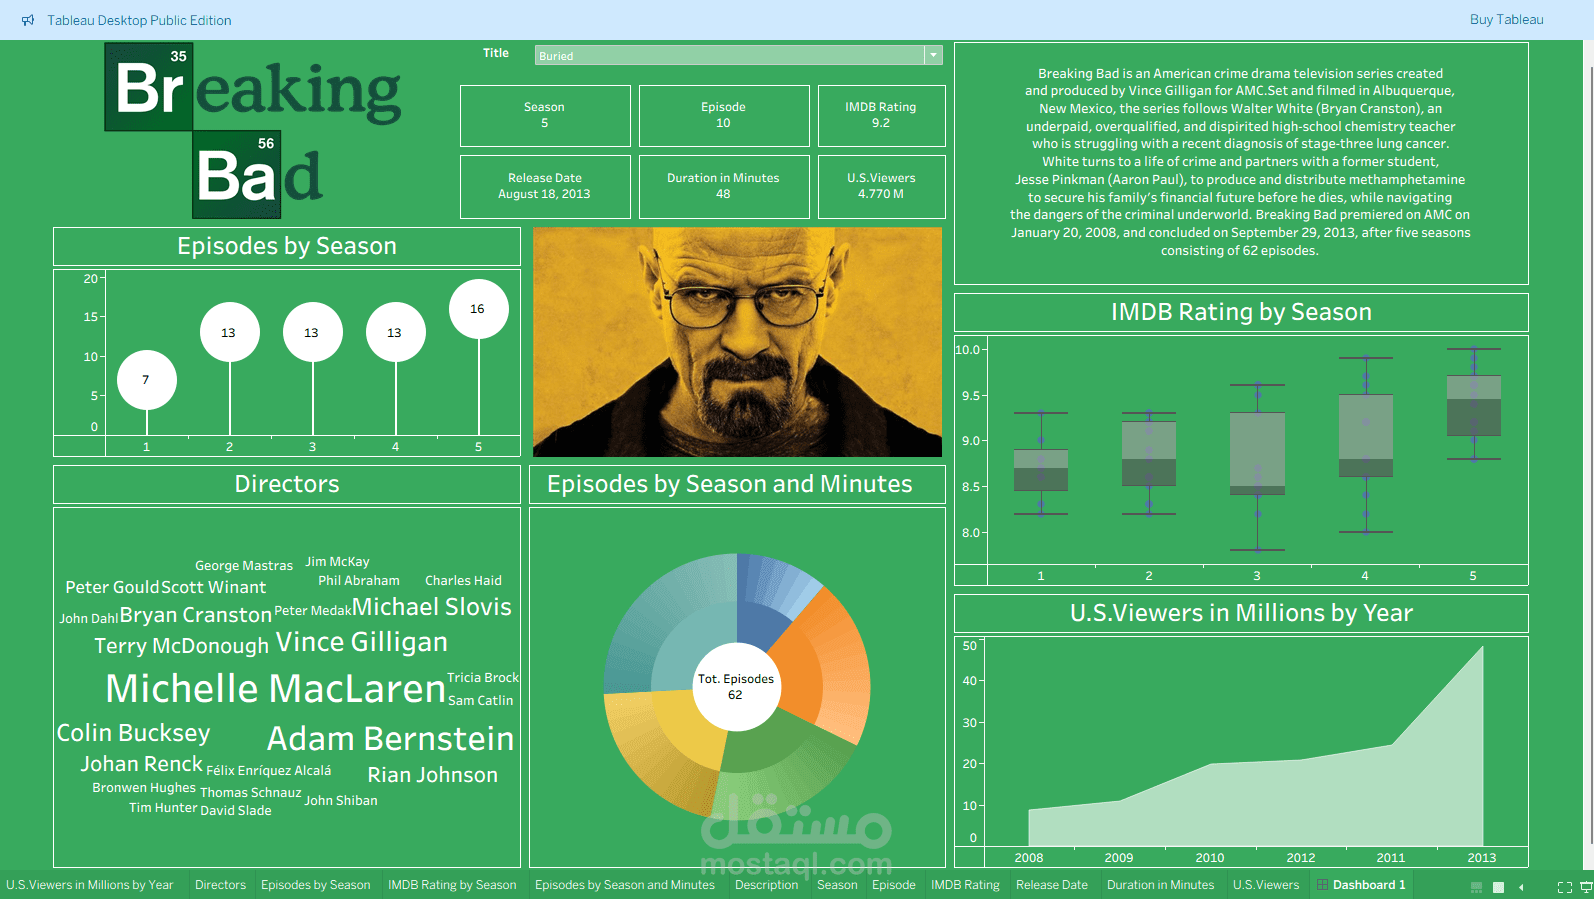
I built an interactive dashboard that provides a comprehensive analytical overview of the Breaking Bad TV series using Tableau Public.
The dashboard highlights key insights, including:
Number of episodes per season
⭐ IMDB ratings by season
Top directors involved
⏱️ Episode duration analysis
U.S. viewership trends over the years
The goal was to transform raw data into a clear and engaging visual story, uncovering patterns and trends in the show's performance across all five seasons.