Sales and Profit Analysis
تفاصيل العمل
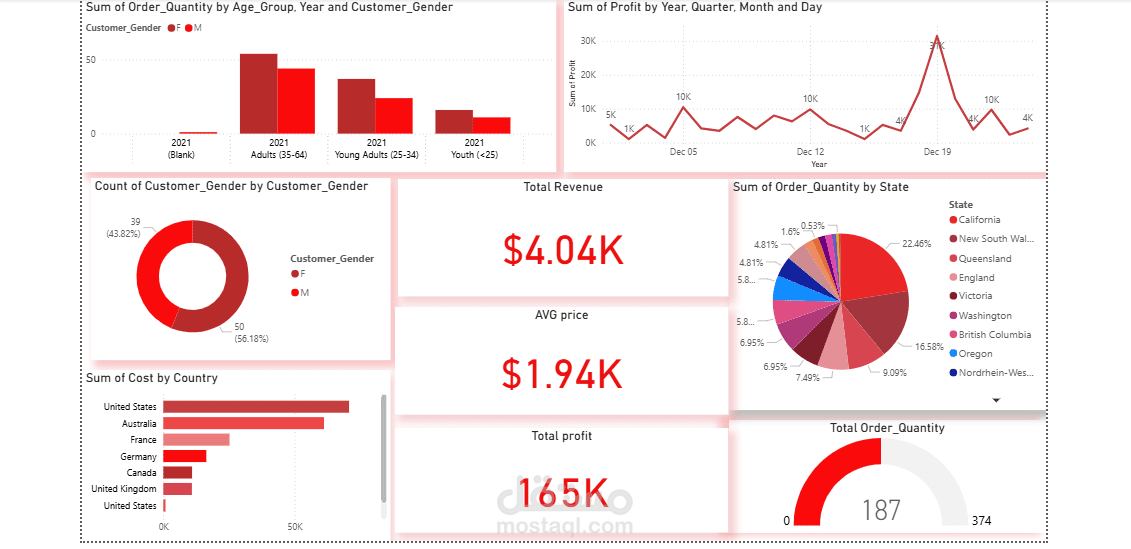
This dashboard is a Sales and Profit Analysis, providing insights into customer data, order quantity, revenue, and cost.
Key Performance Indicators (KPIs)
The central cards summarize the financial performance:
Total Revenue: $4.04K
AVG Price: $1.94K
Total Profit: $165K
Total Order_Quantity: 187
Customer and Order Analysis
Sum of Order_Quantity by Age Group and Customer_Gender:
This bar chart shows that the Adults (35-64) age group has the highest order quantity, followed by Young Adults (25-34).
The split between male (M, darker red) and female (F, lighter red) order quantity is also visible for each group.
Count of Customer_Gender by Customer_Gender:
The donut chart shows the gender ratio: Male (56.18%) customers slightly outnumber Female (43.82%) customers.
Sum of Profit by Year, Quarter, Month and Day:
The line chart shows profit trends over time, with a significant peak in profit around December 19th.
Sum of Cost by Country:
The horizontal bar chart ranks countries by cost. The United States has the highest recorded cost, followed by Australia and France.
Sum of Order_Quantity by State:
The pie chart shows the geographic distribution of orders. California accounts for the largest share of orders at 22.46%.