Global Unemployment Analysis Dashboard (Tableau)
تفاصيل العمل
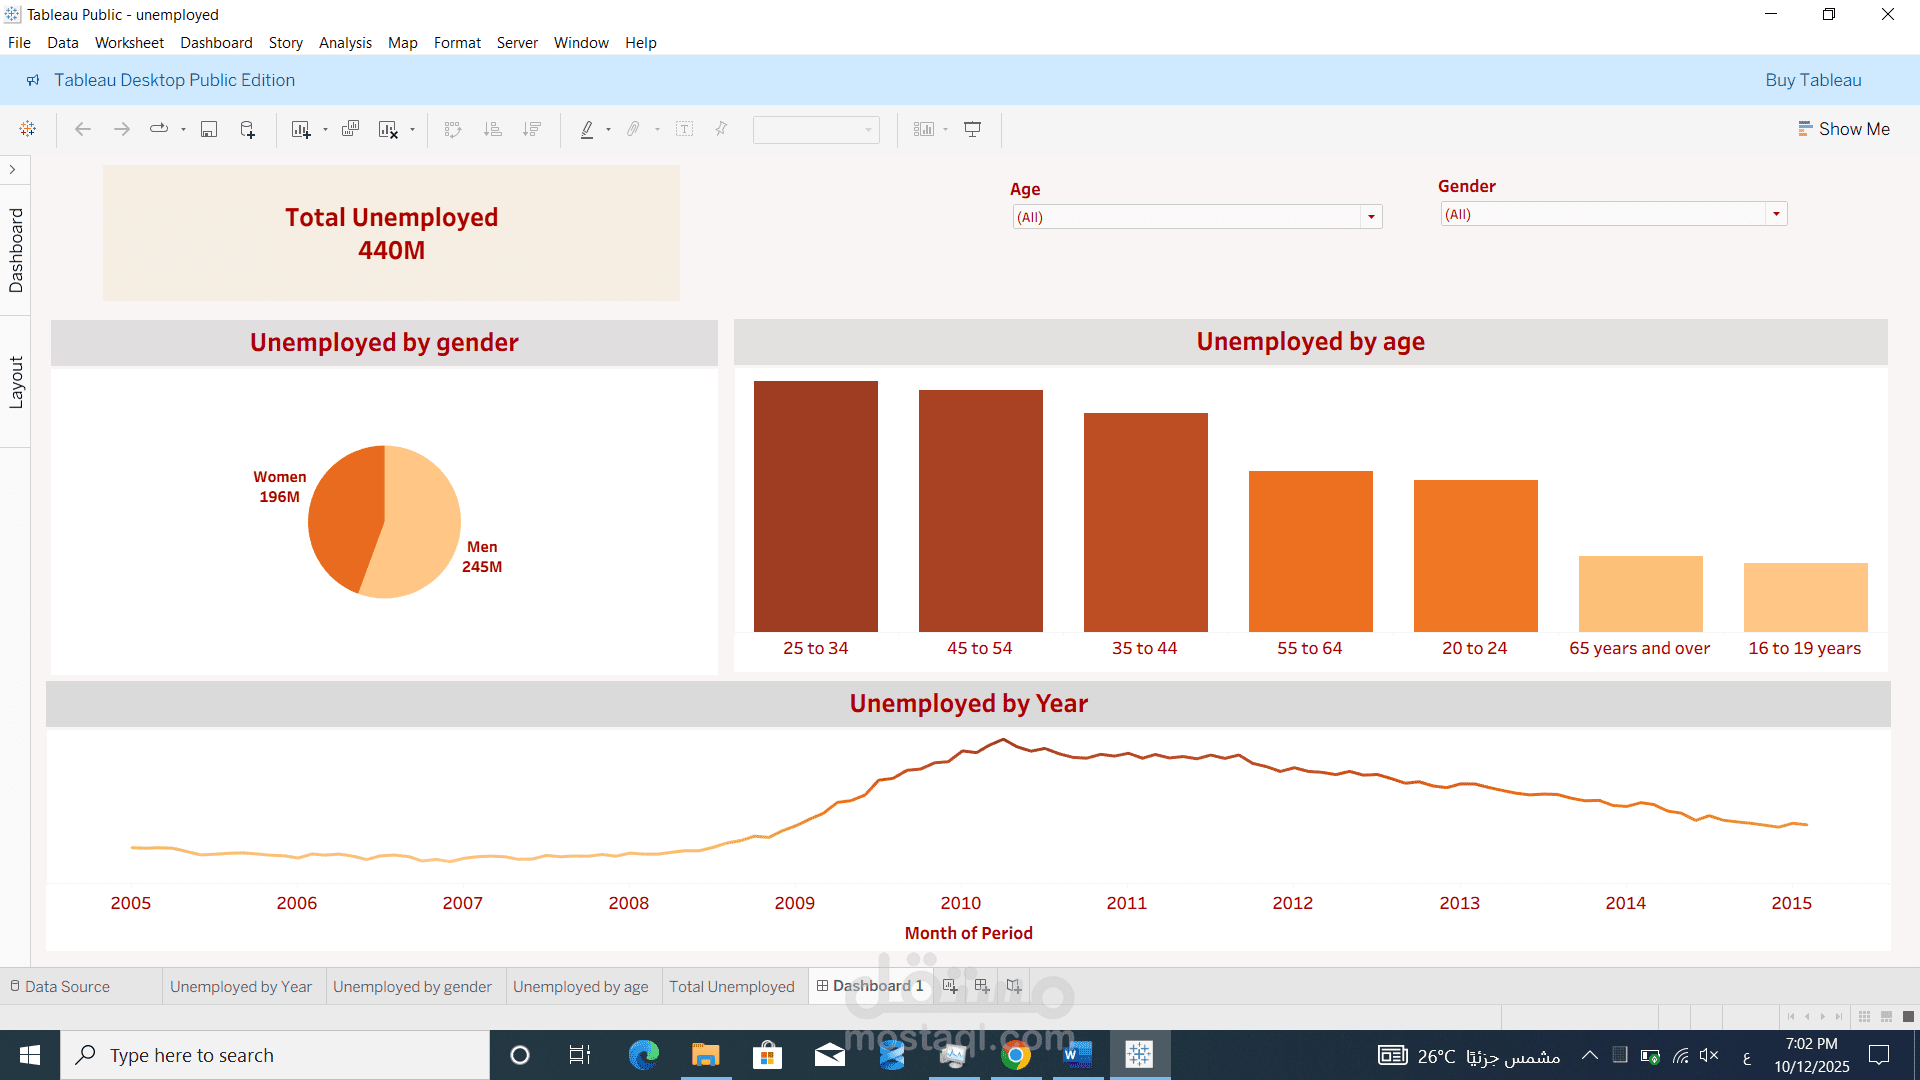
• Built a Tableau dashboard visualizing unemployment statistics across gender, age, and time (2005–2015). Displayed key insights such as gender disparity (55.7% men vs. 44.3% women) and the impact of the 2008 financial crisis.