telocommunication industry
تفاصيل العمل
Project Summary: Telco Customer Churn Analysis
In this project, I worked on the Telco Customer Churn dataset from Kaggle.
The main steps included data cleaning, exploratory data analysis (EDA), and data visualization.
Data Cleaning:
I handled the missing values found in the TotalCharges column by cleaning and correcting them. Other columns did not require further cleaning since the dataset was generally well-structured.
Exploratory Data Analysis (EDA):
I explored the dataset to understand customer behavior, identify churn patterns, and analyze relationships between variables such as tenure, monthly charges, and internet service type.
Data Visualization:
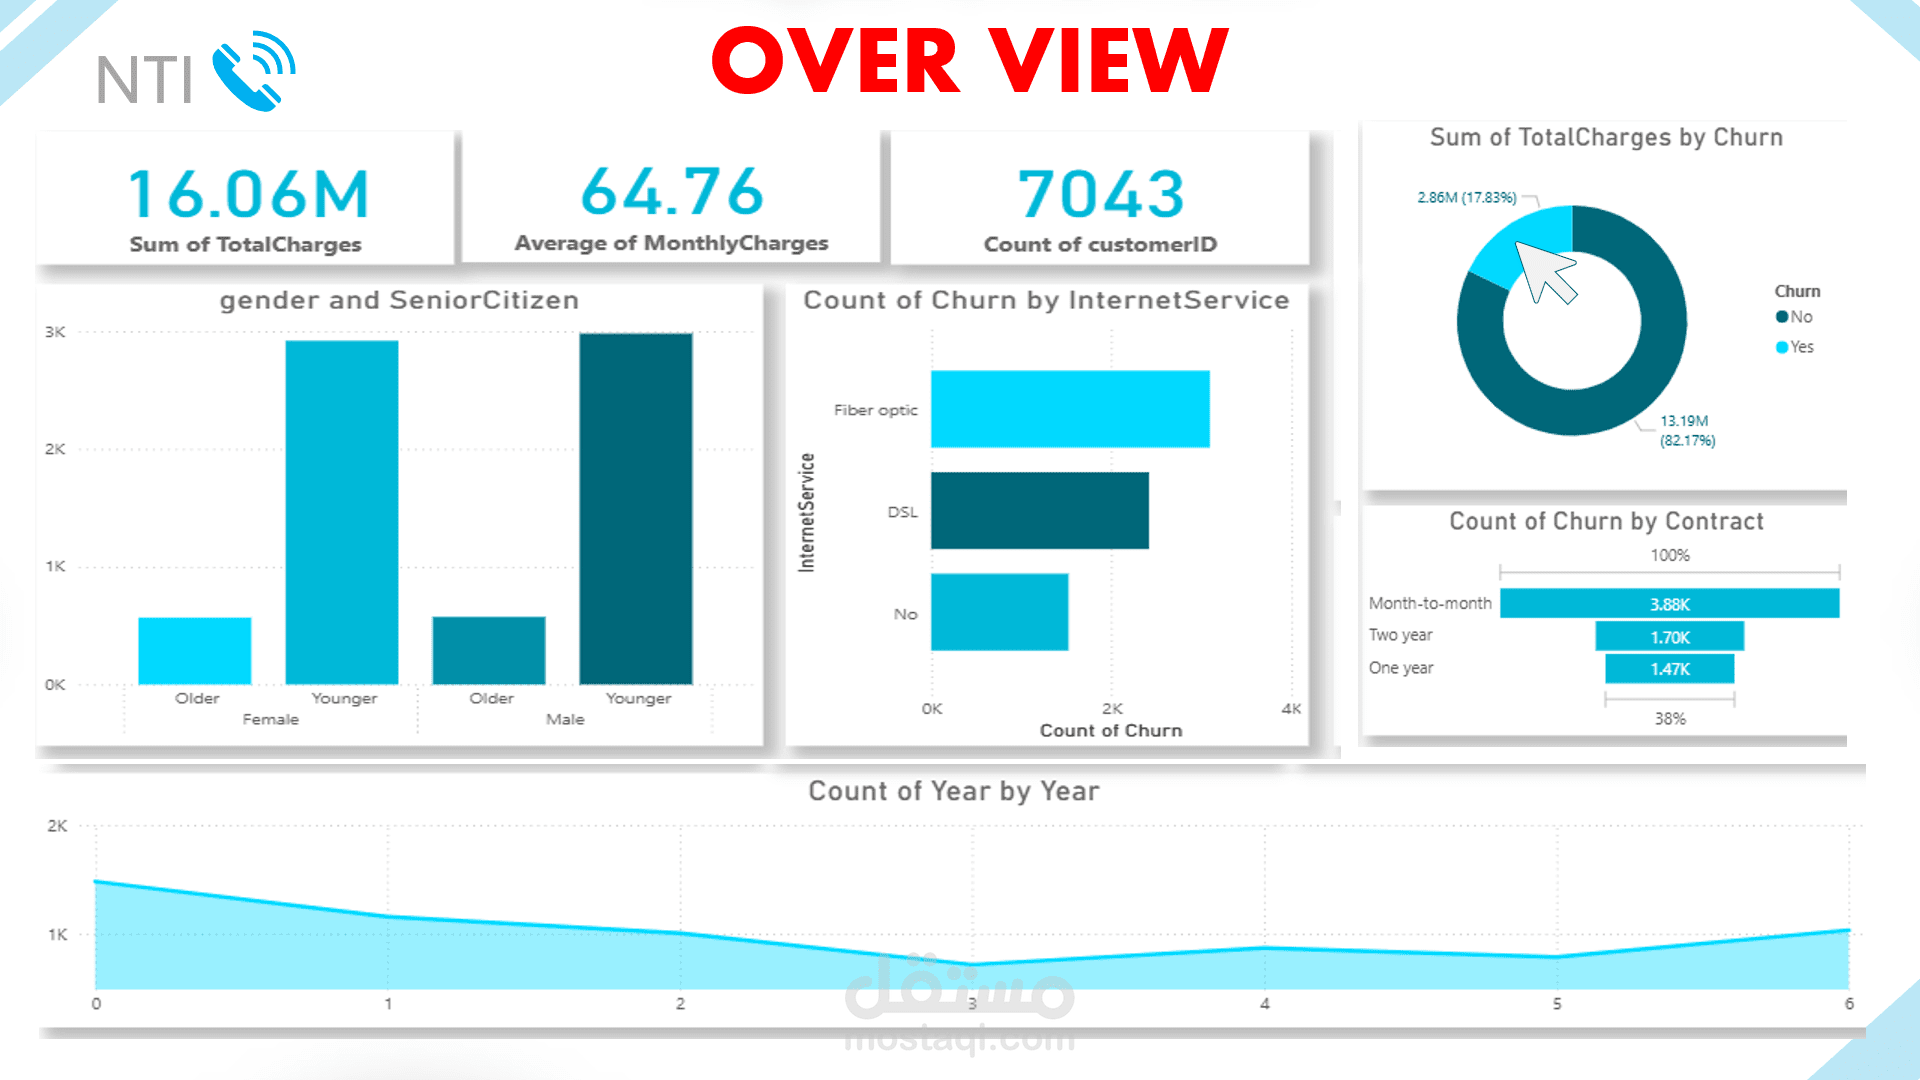
I used Power BI to create four interactive dashboards:
Overview Dashboard – provides general insights and key metrics about customer churn.
Demographics Dashboard – focuses on customer characteristics such as gender, senior citizen status, and contract type.
Services Dashboard – analyzes customer subscriptions like internet, phone, and streaming services.
Billing & Tenure Dashboard – visualizes payment methods, total charges, and customer tenure distribution.
This project helped me develop strong skills in data cleaning, analysis, and visualization using Power BI, while gaining insights into factors influencing customer churn.